Clinker and cement reactivity in process control: automated isothermal heat flow calorimetry in lab automation
Reactivity of clinker and cement is the unknown in today’s binder production. All analytical data collected in process control is not directly related to product performance. A new approach quantifies reactivity of clinker and cement from isothermal heat flow calorimetry. The results are returned fast enough to be used for process control. Here we report analytical accuracy and resolution of the first automated isothermal calorimetry analyzer (polabCal). This technique previously used only in lab environments is now ready for process control. The data obtained is available for rapid decisions to improve processes and to get a previously unreached consistency in clinker and cement production.
1 Introduction
Today the main task in cement production is improving sustainability by reducing emissions and fuel consumption while producing reliable products at competitive cost for the construction industry. Less clinker and more composite materials is the challenge for the cement industry. The control and optimization of clinker and cement reactivity is one important key to reach these targets. A problem today is that clinker and cement reactivity are not quantified at cement plants, except by slow and indirect methods like compressive strength testing.
Compressive strength testing verifies standard compliance of cementitious binders in mortar and concrete. Compressive strength data is also used for benchmarking to provide information for commercial strategies. This analysis is needed to certify applicability in construction works. Compressive strength testing is usually recorded from composite samples (daily average). It takes at least another 24 h to produce compressive strength data from the composite samples due to the fact that the mortar needs to hydrate before the strength testing. Due to the limited number of samples – typically once per day – the compressive strength data density is low. Both the delay of the results and the small data sets constrain the use of this data for process control. Two further limitations of compressive strength testing are personnel with skills to perform compressive strength testing and the availability and cost of such tests. Even then, there is also a considerable analytical error especially for compressive strength at early dates [1].
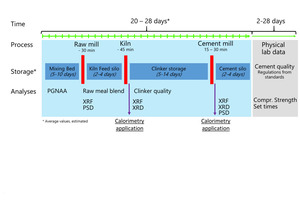
Those constraints of compressive strength data force quality control in cement plants to extrapolate the expected product performance from chemical, mineralogical, and fineness data collected from intermediate and final products during production. Safety margins are added to compensate uncertainties. Finally, it has to be considered that clinker and cement production is a discontinuous process interrupted with periods for storage of intermediate and final products (Figure 1). Long storage times complicate and limit the feedback from compressive strength data back to process decisions.
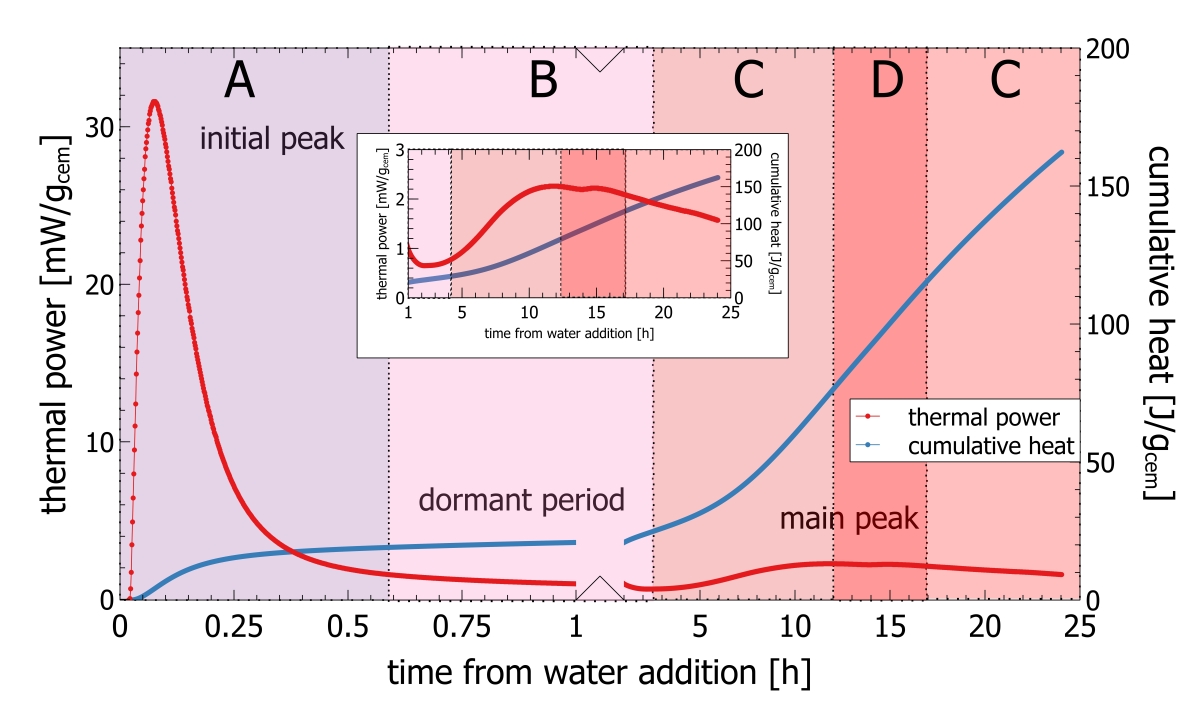
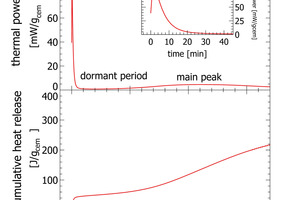
Recently isothermal heat flow calorimetry has been suggested as a new analytical tool for process control [2-5]. Isothermal heat flow calorimetry is used to monitor the heat released from a hydrating cement paste or clinker paste over time [6]. Heat release from hydrating cement is a bulk signal integrating reactivity effects from mineralogy, cement fineness, sulfur carrier addition and cement admixtures. If applied for process control characteristic parameters derived from isothermal heat flow calorimetry can be used as a set point. Any deviation from the set point can be quantified and translated into operational parameters. The key of isothermal heat flow calorimetry to process control, is the use of the initial peak appearing within the first few minutes of hydration (Figure 2).
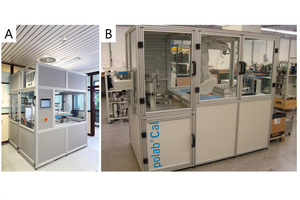
From first conceptual studies thyssenkrupp Industrial Solutions developed a prototype of a fully automated isothermal heat flow calorimeter called polabCal, and tested this at two cement plants for three years. Technical experiences from the prototype were integrated into an improved design ready for deployment in automated cement industry laboratories (Lead picture, Table 1). The improvements include an improved temperature control of materials and enclosure, a decreased footprint, and connectivity to the polab laboratory automation systems. This paper summarizes analytical results from the operation of the prototype.
2 Methods
Integration of isothermal heat flow calorimetry into lab automation required the translation of a manual sample preparation procedure into a reliable and reproducible automated process taking care on the specific environmental needs of the analyzer – mainly temperature control.
2.1 polabCal
The polabCal comprises a completely temperature controlled enclosure with the equipment for sample preparation and the I-Cal Flex analyzer to conduct isothermal calorimetric analyses located inside [8]. The polabCal can be charged with samples from a sample input magazine mounted outside the enclosure (Lead picture) or it can be part of a lab automation system, where polabCal receives the samples directly from automatic samplers in the plant. The automated sample preparation procedure follows predefined recipes containing necessary parameters (sample weight, water to cement ratio, measurement time, mixing intensity, a priority code). Once inside the enclosure samples are handled by an industrial robot. First, the powder (clinker or cement) is dosed to a vial and the vial lid is closed. The charged vial is forwarded to a waiting area. Once the system reports, that one calorimetric cell is available, the vial with the powder is moved to a combined cap screwing/water addition/pneumatic mixing position. The activation fluid (usually deionized water) is injected by volume into the vial. The volume of the activation fluid is calculated from the powder weight in the vial and the targeted water/cement ratio. Instantaneously after water addition and reclosing of the lid a high shear pneumatic mixing homogenizes powder and activation fluid to paste.
The vial with the mixed paste is inserted into the calorimeter cell within less than a minute as the very early reactions are triggered as soon as the activation fluid is mixed with the cement. The total measurement time can be freely defined according the choice of the user. For process control in most instances 30-60 min of measurement time are sufficient. Extended measurements can be used for instance to confirm low heat properties of cements (after 7 days) or to monitor the main hydration peak within the first 1-3 days. When the targeted measurement time expired, the vial is retrieved and discharged and the empty channel on the calorimeter is reported “available” for subsequent samples.
The polabCal is operated from the AQCnet proprietary software and a Siemens S7 based PLC system. During operation all parameters like prioritization of samples, sample size, mixing intensity, water to cement ratio and measurement times can be freely fixed and stored in recipes through the AQCnet GUI. During active measurements, data is continuously transferred to AQCnet and characteristic parameters are extracted and compared to set points. Each vial is barcoded and can be tracked in case additional analyses of the hydrates are considered. One calorimetric analyzer has 8 channels for parallel measurements. One polabCal unit can integrate up to four calorimeters with a total of 32 measurement cells.
2.2 Isothermal heat flow calorimetry and I-Cal Flex (Calmetrix)
An I-Cal Flex consists of a precision thermostated chamber that holds 8 calorimeters. In each calorimeter the heat flow rate from a sample – for example cement paste – is monitored by the electronics (Figure 2). The data is analyzed as thermal power over time or the data is integrated to plot cumulative heat release over time. The data can be interpreted as measured, but more often the data is normalized to a common sample size (i.e. mW/gcement, J/gcement).
A typical heat flow calorimetric pattern consists of an intense initial peak within a few minutes after adding the activation fluid followed by the dormant period and the main hydration peak (Figure 2). The initial peak is attributed to the dissolution of clinker phases, mainly C3A and free lime. The dormant period is characterized by a low thermal power. The main hydration peak following after some hours is attributed to hydration of C3S [6]
In routine work the initial peak as shown in the insert in Figure 2 is difficult to record. Even very small temperature differences between the environment and the calorimeter would be recorded with the signal and the interpretation would be erroneous. For this reason, conventional isothermal calorimetry measurements with external mixing only exploit data recorded after the initial peak and base line stabilization from about 30 min after paste mixing. Measurements can also be made with internal mixing, but this involves a lot of manual work and can only be made with low mixing energy
Waiting time for base line stabilization is the major constraint for fast isothermal calorimetry measurements. This waiting time can be overcome when the temperature difference between outside the calorimeter thermostat and the sample preparation volume is close to zero. In polabCal precise temperature control in the polabCal enclosure and inside the I-Cal Flex calorimeter avoid temperature artefacts and facilitate instantaneous data recording including the initial peak. Only a small delay (45-60 s) after sample mixing is needed for sample transport.
I-Cal Flex by Calmetrix is an isothermal heat flow calorimeter. The access to the calorimeters for charging and removing vials has been designed to be ready for automation [2]. The internal temperature level is maintained accurately. The reference cells are mounted within the measurements cells. The data interface of the I-Cal Flex is ready to communicate with external software and PLC systems. The calibration of the analyzer can be conducted with a well-defined thermal impulse. The access to the calorimeter for vial input is ready for robot handling. AQCnet extracts characteristic parameters from the calorimetric pattern transferred from the CalCommander software for process control.
2.3 Materials and sample preparation
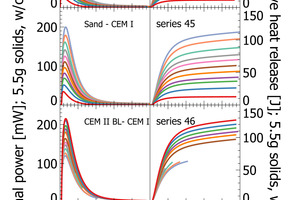
This work focuses on analytical reliability of the polabCal system. We tested the accuracy of the system with four sets of blends prepared from industrial cements. For this we chose industrial cements and ground sand from a single plant as end-members and prepared intermediate lab cements by mixing the end-members in steps of 10 wt.-%. We thus obtained four sets each comprising eleven samples (100/0; 90/10, 80/20…..0/100). Each sample is characterized by individual composition and individual reactivity in terms of heat release and thermal power (sand to CEM I [series 44 and series 45], CEM II BL to CEM I [series 46] and CEM II BL to CEM II AL [series 47]). The series of sand and CEM I define a maximum range from an inert sample to a high reactivity sample. Series 46 and 47 cover shorter compositional ranges and they can be used to evaluate analytical resolution.
Blended samples of known composition are a perfect way to simulate the industrial process. In industrial production a cement is produced from several mostly homogenous raw materials stored in hoppers. The reactivity of all constituents of cement including clinker is not known, unless the final binder production has been completed. During process control a minimum deviation from a set point is targeted (i.e. by controlling separator or clinker factor). In practical process control, polabCal contributes to improved consistency in terms of reactivity of cements and optimized reactivity of clinker.
3 Results
3.1 Raw data
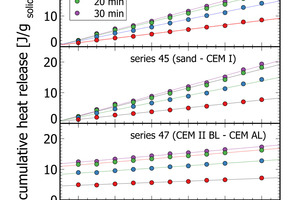
The results section focuses on initial peak measurements only. Series 44 and series 45 are mixed lab cements ranging from inert sand to CEM I. The first visual inspection of the thermal power curves confirms vertical stacking of the curves with sand giving the lowest thermal power and CEM I giving the highest thermal power (Figure 3). The individual curves are aligned almost at equidistance, which is a clear indication of linearity following the increasing clinker content of lab cement. Cumulative heat release is depicted in the right column of Figure 3. Within the first 2-3 min there is a rapidly increasing signal from the calorimeter. After 10 min the reaction decelerates as seen from the flattening slope. After 20 min the calorimetric signal decreases further towards the low thermal power during the dormant period. The cumulative heat release curves within the sample series are also clearly aligned in equidistant steps. This confirms also for this signal linearity with increasing clinker content.
The heat release recorded for pure sand is expected to be nil. The actual positive offset from zero is due to temperature offsets between inside the enclosure and inside the calorimeter during the measurement. This issue has been solved in the final design of the polabCal, and the thermal power of measurements with sand will then be close to zero. Series 46 and 47 give blends of CEM II BL, CEM I cements and CEM II AL (four curves of series 46 are shorter because of experimental problems). Also for these series logical vertical stacking of the curves is seen.
3.2 Data analyses
Process control requires a numeric data set corresponding to cement and clinker composition. In practice, these set points are used to define targets and lower and upper limits which separate areas of accepted variation from areas where interference to the process is required to maintain a certain quality level. In the past a mainly comparative use of isothermal calorimetry and long measurement times excluded its use in process control.
Characteristic data points within the first hour of measurements are peak height of the initial peak, time at the first peak or cumulative heat values for instance at 5 min, 10 min or 20 min. The data points were extracted from data plotted in Figure 3. This data was also used for regression analyses (Table 2).
3.2.1 Peak maxima
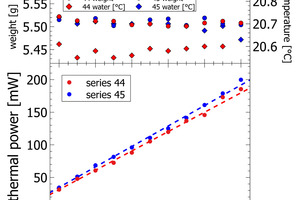
Figures 4-5 depict the correlation of lab cement composition versus the thermal power recorded at the maximum of the initial peak. Figure 4 shows sand-CEM I mixes. Even though measured on the same materials both lines are not completely overlapping. This shift is due to a minor temperature difference of 0.1 K in the water added to the powder to prepare the paste of series 44 and series 45. The slope itself for the sand – CEM I mixes confirms a linear correlation between thermal power and lab cement composition. The regression data reported in Table 2 shows a Y-intercept deviating from the origin in sand samples. This deviation is due a slightly different temperature level inside the I-Cal Calorimeter and the polabCal enclosure. This deviation adds a constant value to all results of each series. The slope confirms there is a resolution of 1.5. mW per percent of clinker. The slope as seen in Figure 4 would be a characteristic for a clinker at a given fineness and reactivity.
Clinker reactivity is the unknown in cement production. Today, there is no direct way to assess reactivity data of clinker and cement. If clinker added to the cement mill is characterized by a variation in reactivity, then the thermal power recorded would no longer fit to the targeted values. In this case the polabCal signal would be used to compensate reactivity changes by changing separator settings or clinker factor.
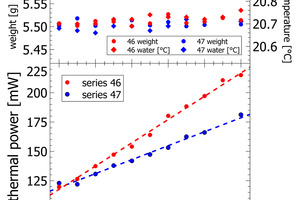
In series 46 and 47, the lab cements are differentiated by varying clinker content and varying limestone content (Figure 5, Table 2). For both series we observe a constant change in thermal power with the mixing ratio of the end-member cements. In process control the thermal power signal can be used to correct the limestone content or the separator settings to compensate observations in cement reactivity. In series 46 the complete compositional range is from 26 wt.-% limestone to less than 5% limestone in CEM I. In series 47 the limestone content varies from 26 – 18 wt.-%. The results obtained for both series confirm a resolution in the order of 0.1-0.2 Wt.-% of limestone with the calorimetric signal.
3.2.2 Cumulative heat recordings within the first hour
The flattening of the power curve in Figure 3 indicated well the transition from the initial peak to the dormant phase roughly 20 min after paste production. Figure 6 depicts cumulative heat release data at 5 min, 10 min, and 20 min after mixing of the paste for three of the measurement series. At each time interval a linear increase of cumulative heat release correlates with the mixing ratio in the respective lab cements. After 20 min, the dormant period is reached with very small additional heat release (Figure 3, Figure 6). After 30 min only minor changes relative to 20 min measurements are apparent. In terms of process control this means a measurement time of 20-30 min is sufficient to quantify the heat release of cements in isothermal analyses. This signal can be also used for process control, as seen from the correlation analyses in Table 2.
4 Discussion
In the cement plant there are no knobs to directly modulate reactivity during production. The reactivity of clinker and cement is anticipated from chemical and mineralogical data and fineness data. The data reported here – collected with the prototype of polabCal automated calorimeter – confirms a high correlation of calorimetric signals with cement composition. There is no doubt, that the mixes analyzed here would show also a correlation of composition and compressive strength – even though compressive strength data was not collected. The strong linear correlation of thermal power and cement composition confirms the rapid assessment of a reactivity value ready for process control. The high correlation of composition with a choice of parameters extracted from isothermal heat flow calorimetry recorded with I-Cal Flex confirm suitability for process control (Table 2).
The principal unknown in current quality control in cement plants is the reactivity of clinker. This leads to two locations to apply isothermal calorimetry for process control: after the kiln and after the cement mill [5]. The application of polabCal data at the cement mill is straightforward, as only fineness or weigh feeders need to be tuned to return to a targeted reactivity. The situation at the kiln is more complex. On a longer time scale the raw mix composition can be adapted by changing the moduli over time. The impact of those changes would be seen at the polabCal after feeding modified material to the kiln. If done in increments those changes can be monitored within days with the target to rise clinker reactivity.
A faster response of the clinker reactivity can be triggered by using ash from fuels and the flue itself to exploit the complex interaction of fuels and volatile cycles: it is known, that carbon rich flue gas (CO2, anthracite, petcoke) minimizes volatile cycles while fuels adding water to the flue gas increase volatilization of alkalis and sulfur [7, 8]. By modifying fuel composition clinker reactivity can be modulated. In the past there was no way to monitor this effect. Now polabCal can be applied to target changes of clinker reactivity during production.
5 Conclusions
The assessment of clinker and cement reactivity overcomes a deficiency of process control in clinker and cement production. Although valuable to understand the clinkering reactions and the cement composition, quantitative XRD does not directly assess reactivity; automated calorimetric reactivity measurements close this gap. Automated reactivity measurements overcome this issue, as reactivity itself becomes the data and the quality of clinker and cement is directly assessed. With polabCal subsequent samples are compared to each other and the changes from sample to sample are used to identify required actions in process control to maintain a targeted quality.
The polabCal data as shown above monitor reactivity changes of clinker and cement close to the process and opens the way to adjust the process fast. The polabCal is not constrained to one hour measurements only. The highly reproducible automated sample preparation also improves reproducibility of long term measurements. This is an only question of what data is required and the availability of channels at the I-Cal Flex.