The cement industry in Europe at the crossroads
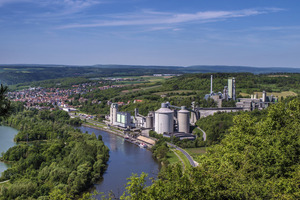 Heidelberg Materials
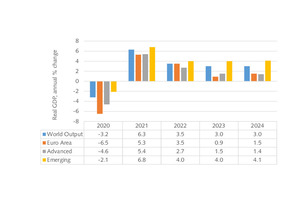 IMF, WEO
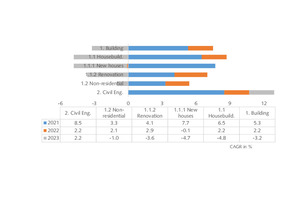 FIEC
FIEC
 [6]
[6]
 [6]
[6]
 [6]
[6]
 EU ETS
 Trading Economics
 EU Innovation Fund
 Devnya Cement
 Cemex Germany
 Holcim Deutschland
 OneStone Research
 OneStone Research
 OneStone Research
 Destatis, OneStone Research
 Destatis, OneStone Research
The cement industry in Europe is on a transformation path towards carbon neutrality. What kind of structural change will be necessary and how competitive will the cement industry be across the European countries and other world regions after these structural changes have materialized? This article will give an insight and provide answers to these questions.
1 Introduction
It is obvious that the development of the cement industry in Europe (EU27) depends largely on the economic growth and construction development in the region. Other factors with growing importance are the decarbonisation of the industry, the ECT carbon pricing, the removal of free allocations, rising production costs, the availability of financial and raw material resources, the competitiveness of the industry and finally the ability of the cement producers to cope with these issues. In the latest World Economic Outlook (WEO, July 2023) by the International Monetary Fund (IMF), global growth is projected to fall from an estimated 3.5% in 2022 to 3.0% in 2023 and 2024 (Figure 1). Inflation is decreasing in most countries but remains high. In the Euro Area GDP growth will be a projected 0.9% in 2023 and 1.5% in 2024 below the growth in the Advanced Economies. Growth in Germany is even projected to be negative in 2023 with -0.3%.
Euroconstruct confirms 3% growth in the European construction market in 2022, while revising downward the new forecast for 2023 (-1.1%) and 2024 (-0.7%) because of the challenges ahead. The expectations of recovery for the construction sector have been postponed to 2025. In the latest report by FIEC (European Construction Industry Federation) [1], the outlook for 2023 in Europe is more pessimistic, with investment in construction expected to fall by -2.5% (Figure 2). While in 2022 in Europe the total investment in construction was € 1456 billion, which made up 10.1% of the GDP in the EU27, in 2023 this amount will decline by about € 35 billion. The largest losses are in the housebuilding sector with a projected decline by -4.8%. Highest losses in this sector are in Sweden (-26.6%), Italy (-18.6%), Czech Republic (-14.9%) and Denmark (-13.6%). Germany, the largest economy, will have projected losses in new housebuilding of -8.1%.
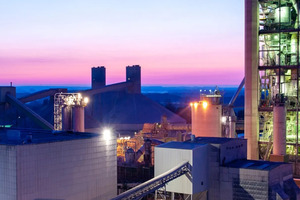
Despite the economic challenges in the construction sector in Europe, the journey of the cement industry towards carbon neutrality in 2050 is accelerating [2]. According to Cembureau, the European Cement Association, the specific CO2 emissions in the EU shall be reduced from 783 kg CO2/t of cement to 472 kg CO2/t of cement by 2030, corresponding to a decline by 39.7% and zero CO2/t of cement by 2050 [3]. Is this still valid? The European Commission (EC) announced in July 2021 under the European Green Deal the “Fit-for-55-package” to reduce its net greenhouse gas (GHG) emissions by at least 55% by 2030 compared to 1990 levels. Accordingly, there is a discrepancy between the EU and the Cembureau projections about the necessary CO2 reduction initiatives by 2030. On the other hand, the European cement industry will still have free CO2 allowances under the EU Emission Trading System (EU ETS), which has started its phase 4 stage (2021 to 2030) [4].
2 EU27 Cement industry projections by 2030
In their latest data collection [5] for the EU27 Cembureau published a cement production figure of 182.5 Mt/a and cement consumption of 170.5 Mt/a for 2021. However, maybe because of different sources for the data, the production figure does not even correspond to the global production figure of 4.3 billion t and the 4.1% share for the EU27 stated by Cembureau, which would result in 176.3 Mt/a production in 2021. Since 2023, OneStone Consulting has been publishing its own independent research figures for the global cement industry [6]. The publication is called CCF2Up and comprises data on the cement production, consumption, net trade, PCC, cement capacities, utilisation and economic data for 130 cement countries across the world. These 130 countries comprised 99.5% of the global production and 99.3% of the cement consumption in 2021. The data is provided in an Excel-File and can be re-arranged to individual country groups, like the EU27.
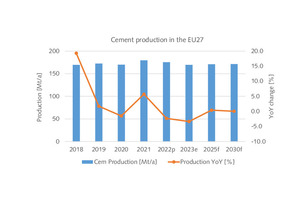
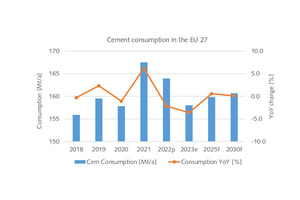
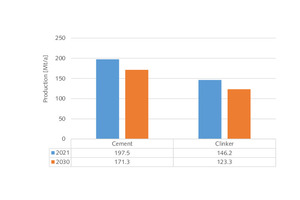
Beside historical data, CCF2Up provides forecasts for two periods and this is updated twice a year in April and October. The latest data for the EU27 result in a cement production of 179.5 Mt/a in 2021 (Figure 3). Of the last few years, 2021 was a peak year with an y-o-y increase of 5.7%, after the production decrease due to the COVID19 pandemic in 2020. Cement production in the EU is projected to decrease by 3.3% in 2023. Between 2025 and 2030 production will only slightly recover to about 171.3 Mt/a, which is well below the 2021 figure. Cement consumption in the EU27 was 167.5 Mt/a in 2021 (Figure 4), which corresponds to a per capita consumption (PCC) of 376 kg/pcc. Cement consumption in the EU is projected to decline to 160.7 Mt/a by 2030. However, because the population is also projected to decline, this will still result in a PCC of 368 kg/pcc by 2030.
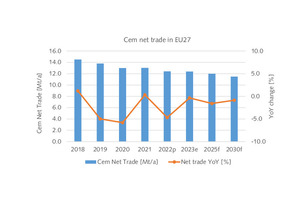
According to these figures, the cement net trade of the EU (intra- and extra-EU trade) will decline from 13.0 Mt/a in 2021 to 11.0 Mt/a by 2030 (Figure 5). In our projection cement capacity in the EU will decline from 274.8 Mt/a in 2021 to 269.1 Mt/a by 2030, leading to capacity utilisation rates of only 65.3% in 2021 and 63.7% by 2030. However, when the road to carbon neutrality is the topic, then the clinker capacities and clinker utilisation rates become more important, because the clinker process is responsible for about 2/3 of the direct CO2 emissions of the cement industry. With a clinker factor of 74% in 2021 (Cembureau) the EU27 clinker production was about 146.2 Mt/a. OneStone Consulting has the data for the global kiln plants ordered since 1965 and still operational today. This results in 235 kilns in the EU with a combined capacity of 205.2 Mt/a. Accordingly, in 2021 the clinker capacity utilisation in the EU would have been 71.2%.
3 The journey to carbon neutrality in the EU
According to the European Commission, the revised EU ETS Directive provides predictable, robust and fair rules for addressing the risk of carbon leakage. The Directive is regarded as a cornerstone of the EU’s policy for combatting climate change and a key tool in reducing greenhouse gas emissions cost-effectively. It was the world’s first major carbon market scheme and remains its largest. The key parameters for the cement industry by the EC are available in an updated Directive from October 2021 [4]. For the production of grey cement (BM10) the average GHG emissions of the 10% most efficient clinker installations in the EU have been 0.722 t CO2e/t cement, while the average figure of all 191 installations has been only 0.816 t CO2e/t cement. For the period 2021 to 2025, a new benchmark figure for the EU of 0.693 t CO2e / t cement has been given, which is a reduction by 9.5% over the former benchmark value of 0.766 t CO2e/t cement by 2020.
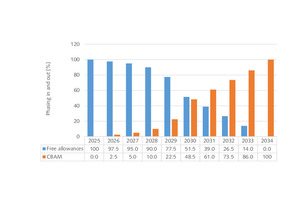
Accordingly, from 2020 to 2025 the CO2 emissions by the cement industry should be further reduced by 9.5%. The new benchmark value for the 191 installations is imposed with free allocations of 90.105 Mt EUA/a (1 EUA allows the holder to emit 1 t of CO2 or CO2 equivalent (e) GHG). For the production of white cement clinker (BM11 with 12 installations) in the EU, another 2.145 Mt EUA/a have been provided. Each one of the installations has received its specific preliminary free EUA. Within the EU ETS reform, the free allowances for companies will be phased-out from 2026 until the end of 2033, while in parallel the Carbon Border Adjustment Mechanism (CBAM) will be phased-in (Figure 6). Accordingly, the phasing-out of free allowances will accelerate after 2027 and therefore it has become a goal for some cement producers in the EU to have in-time, significant carbon reduction technologies in place. Otherwise, each t of emitted CO2e has to be purchased.
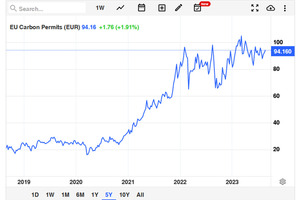
It is very difficult to project the future CO2 prices, because they will depend on a variety of factors, including political will, technological innovation and global trends. Figure 7 shows the actual development of the so-called carbon credits or carbon permits. At the moment the ETS carbon permits have fallen to 93.42 €/EUA (21.08.2023) after they peaked on 27.02.2023 at 105.14 €/EUA. For the year 2030, prices of between 80 and 160 €/EUA are expected [7]. Revenues generated from auctioning EU ETS allowances are an increasing source of income for Member States, and have increased significantly since 2017, driven by an increase in the carbon price. Total auctioning revenues generated under the ETS system amounted to € 31 billion in 2021, of which € 25 billion went directly to Member States. The rest went mainly to the Innovation Fund and the Modernisation Fund.
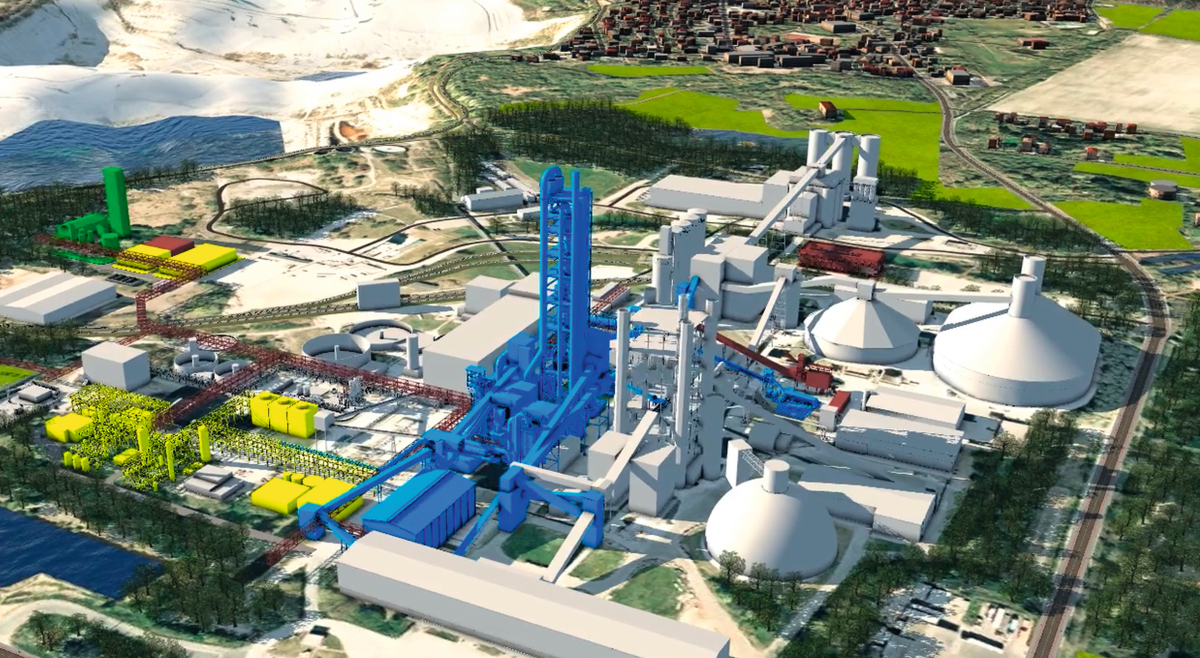
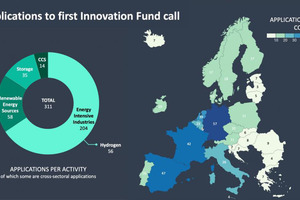
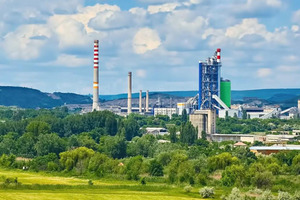
In 2021, the European Union invested over € 1.1 billion into the first seven large-scale innovative projects under the Innovation Fund. The seven projects were selected for funding under the first Innovation Fund call for large-scale projects from 311 applications (Figure 8). 204 projects alone were from the energy-intensive industries such as steel, cement, lime, chemical and others. 4 large-scale projects were selected from the cement industry, including the Go4EcoPlanet project of Lafarge Cement (Holcim Group) in Kujawy/Poland, the ANRAV project of Devnya Cement (Heidelberg Materials Group) in Devnya/Bulgaria (Figure 9), the Carbon2Business projects of Holcim in Lägerdorf/Germany and the K6 project by Eqiom (CRH Group) in Lumbres/France. Table 1 provides the key parameters of the projects. The carbon reduction plans are provided for the first 10 years of each plant operation.
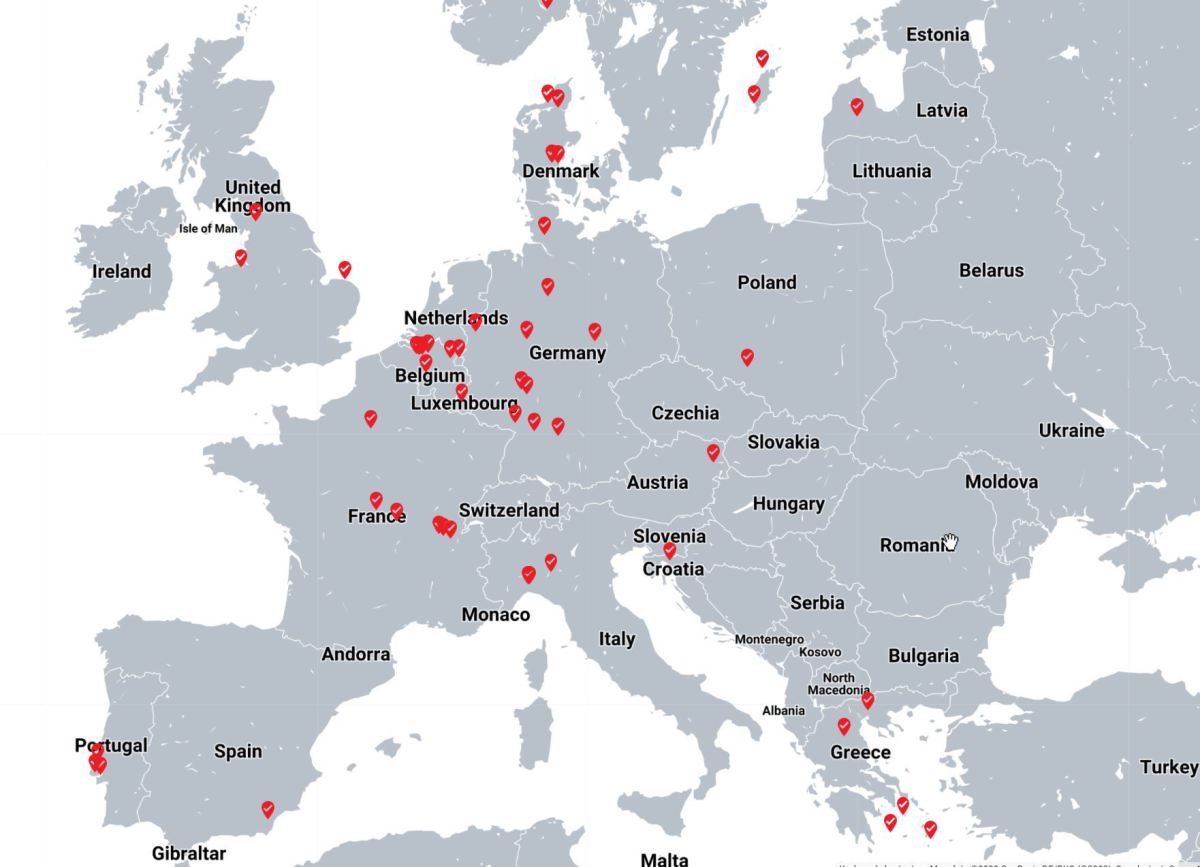
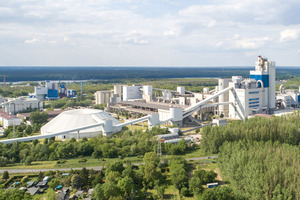
The amount of the funding also goes to project partners such as PetroCeltic, who are responsible in the ANRAV project for the captured CO2 storage in a depleted gas field in the Black Sea close to Varna. This year, the EU Innovation Fund granted more than € 3.6 billion to 41 large-scale clean-tech projects out of a pool of 239 applications, with five projects focused on decarbonizing cement. Additionally, a number of other full-scale carbon capture, utilisation and storage (CCUS) projects have been announced by the cement industry in Europe. In total we identified 15 full-scale projects (incl. full-scale demonstration projects) in the EU, comprising a carbon reduction potential of about 10.8 Mt CO2 per year by the cement producers Cemex (Figure 10), Eqiom (CRH), Heidelberg Materials, Holcim (Figure 11), Rohrdorfer Cement, Titan and Vicat. The 15 plants comprise a clinker production capacity of 15.1 Mt/a, which corresponds to about 10.3% of the EU capacity.
4 Projected structural changes in the cement industry
According to our projection, cement production in the EU27 will decline from 179.5 Mt/a in 2021 to 171.3 Mt/a by 2030. The question is, how much clinker will be required in 2030? If we follow the Cembureau projection, which foresees a decrease in the clinker factor in the EU27 from 74% in 2021 to 70% by 2050, then for 2030 a clinker factor of 72% and a clinker production of 123.3 Mt/a could be realistic (Figure 12). Accordingly, with a clinker capacity of 205.2 Mt/a, a capacity utilisation of 60.0% will result. If a clinker capacity utilisation of 80% is envisaged by 2030, then a capacity of 154.1 Mt/a will be necessary and about 51.1 Mt/a or almost 25% of the existing capacity could be eliminated or early retired. Needless to say that this will significantly impact the cement industry in the EU. At the moment there is already a trend for some older kiln lines to be replaced by larger and more economical kilns, which also offer advantages for CCUS technologies.
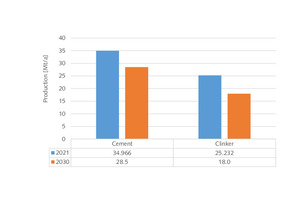
From country to country the necessary structural changes will be different. Mostly affected are countries with a large number of kiln lines and large overcapacities, such as Germany. According to our data, about 34.966 Mt/a of cement and 25.232 Mt/a of clinker were produced in Germany in 2021. According to the VDZ (German Cement Association), a clinker factor of 63% could be possible by 2030. Based on our projection of German cement production of 28.5 Mt/a by 2030, this will result in a clinker production of only 18.0 Mt/a by 2030 (Figure 13). In 2021 there were 54 cement plants with a combined clinker capacity of 102860 t/d or 32.9 Mt/a. Accordingly, in 2021 the clinker capacity utilisation was 76.7%. This figure will decline to 54.7%, if no existing capacity is eliminated. With a projected capacity utilisation of 80% in 2030, only 22.5 Mt/a clinker capacity will be required in Germany in 2030, so that 10.4 Mt/a or 31.6% could be eliminated.
5 Future competitiveness of the cement industry
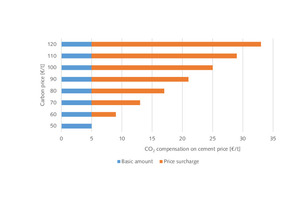
For small and midsized cement producers in the EU, buying EUA offsets can be less expensive than reducing emissions by CCUS projects of their own. Differently to the large cement groups, most of these smaller cement producers have not been able to accumulate enough money to finance full-scale projects. The question is what will happen when the free carbon allowances are phased out. One option is to reduce the CO2 emissions conventionally as far as possible by using alternative fuels, lowering the clinker factor and improving the plant efficiency. It could be another option that the CO2 costs are passed on to the clients (Figure 14). One such example is a smaller producer in Austria, who introduced a CO2 compensation on the cement price, including a basic amount of about 5.00 €/t and a surcharge of 4.00 €/t for each carbon price increase of 10 €/t above 50 €/t. In this example, the CO2 compensation will increase the cement price by 21 €/t for carbon prices of 90 €/t.
We interviewed executives of small and midsized cement producers in Europe. They concluded that their companies are not able to invest in full-scale CCUS technologies without any major funding. However, the practice by the EU Innovation Fund and National initiatives only supports large-scale projects which fulfil a number of outstanding award criteria such as the breakthrough character of the project, the ability to reduce GHG emissions compared to traditional technologies, the level of innovation, as well as the risk factor, scalability and cost effectiveness. According to our interviews, the EU and Governmental project funding up to now results in a distortion of competition in the cement industry. The “early movers”, which are the large cement producers, take advantage of the funding, while for the “late movers” with lower technological risk and technology price improvement almost no funding will be available.
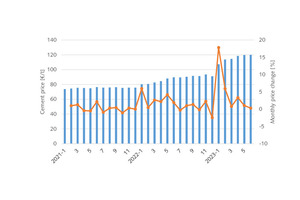
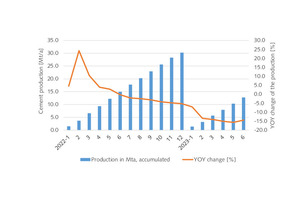
However, in the last few months, cement prices have become an issue. Figure 15 shows the cement price development in Germany since January 2021. The cement prices were calculated from the cement dispatch figures and the cement sales income provided by Destatis, the German Statistics Office. The cement prices in the reported period increased by 62.8%. This mainly reflects the increase in production costs and price inflation in Germany. However, in the last few months a reduction in cement prices has been notified. This mainly has to do with the significant decline in cement production (Figure 16) and the growing competition in Germany regarding market shares. By May 2023, cement production fell by 15.7% compared to May 2022. This also has an impact on the free CO2 allowances of the German cement producers.
The free allowances for the German cement producers for the period 2021 to 2025 are only preliminary, as for all the other EU countries. After each production year the free allowances are adjusted with the actual production figures. The threshold for adjustments was set at 15% and will be assessed on the basis of a rolling average of two years. This means if a cement producer has 15.1% less production in this two years, then for the years to come, the free allowances are also cut by 15.1%. Producers which are not able to offer competitive prices are losing market shares and with lower free allowances in the coming years they will have to buy more carbon credits than their competitors and so they will even become less competitive in the coming years. Smaller producers also do not have the ability to balance the losses in one market with the profits in another market. The result will be a further concentration of cement production capacity and the elimination of smaller producers from the market.
6 Outlook
The EU ETS scheme has a huge impact on the competitiveness of EU cement producers. Up to now, the discussion has been directed at the risk of cheaper cement and clinker imports from outside the EU borders into the EU. Accordingly, the cement industry was on the agenda of future “carbon leakage” risk. However, the number of countries and regions to which companies could relocate their production in order to avoid climate policies has certainly been overestimated because the global efforts to fight climate change have increased. The CBMA is complex but it can effectively equalise CO2 costs between EU and non-EU suppliers. Anyhow, one problem is the growing distortion of competition within the EU because of the large clinker production overcapacities and the growing imbalances because of carbon reduction project funding. In our interviews we were confronted with producers’ fear that cement prices could increase to much more than 200 €/t by 2030, when free allocations are cut by 50% and the market concentrates.
Report 2023 by FIEC the European Construction
Industry Federation, Brussels, Belgium
technologies for cement industries. ZKG Cement Lime
Gypsum 6-2022, pp. 38-47
Reaching Climate Neutrality along the Cement and
Concrete Value Chain by 2050. Cembureau – The
European Cement Association, 12.05.2020, Brussels/
Belgium
for the years 2021-2025 of phase 4 of the EU ETS –
Benchmark curves and key parameters. Updated final
version issued on 12 October 2021, EU Directorate
General Climate Action, Directorate B: European and
International Carbon Markets, Brussels/Belgium
Cembureau – The European Cement Association,
Brussels/Belgium
Focus market report, 1st publication April 2023, 2 updates
per year by OneStone Consulting Ltd., Varna/Bulgaria
A closer look at drivers, models and assumptions. Input
material and takeaways from a workshop in Brussels, 30 November 2022, Kopernikus-Projekt Ariadne, Potsdam-Institut für Klimafolgenforschung (PIK), Potsdam/Germany