The challenge facing CCUS systems for green cement
 Heidelberg Materials
 NOAA
NOAA
 [2]
[2]
 [4]
[4]
 [5]
[5]
 [6]
[6]
 OneStone Consulting, based on [7]
 [8]
[8]
 [8]
[8]
 J. Harder
 [17, 18]
 Northern Lights
 OneStone Consulting, based on [8]
 OneStone Consulting, based on [22]
 UltraTech
 Nuvoko Vistas
 OneStone Research
 OneStone Research
 OneStone Consulting, based on [21]
The illusion that net-zero can be achieved in the cement industry by implementing CCUS systems (Carbon Capture, Utilization and Storage) is about to burst. Here, the projections put forward by the cement industry are discussed in detail and compared with reality. Accordingly, this market review is a wake-up call which also shows that roadmaps for 2050 should be re-written.
1 Introduction
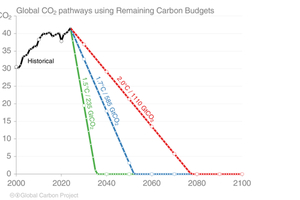
In July 2025, the average atmospheric CO2 concentration at the Mauna Loa (Figure 1) observatory on the Island of Hawaii reached 427.9 ppm, according to the NOAA Global Monitoring Laboratory [1]. This is about 30 ppm higher than in 2016, when the Paris Climate Agreement was signed. There are two main problems. The CO2 in the atmosphere does not condense to a liquid and therefore the greenhouse gas is very long-lasting, persisting for centuries. The 2nd problem is: if there is not a peak in the CO2 concentration very soon, then the average global temperature will dangerously increase. Many calculations exist that provide the details. Figure 2 shows how the CO2 emissions need to be reduced to limit temperature growth [2]. In order for global warming to be limited to 1.5 °C by 2050, then from now on only 235 bn t of accumulated CO2 can be emitted by the total industry, or 9.4 bn t of CO2 per year. Today, the global cement industry alone emits about 2.5 bn t/a of CO2. Can CCUS (Carbon Capture, Storage and Utilization) reduce the CO2 emissions from the cement industry to achieve net-zero?
Net-zero means that not more CO2 is produced than what is absorbed by the natural carbon sinks such as our forests, oceans, fenlands, concrete and other available sinks. The organisation Global Carbon Budget released data showing that in 2023 emissions of about 40.9 bn t of CO2 equivalent were released by the industry and by human activities including travelling. However, an estimated 22 bn t were released to the atmosphere and only 19 bn t were stored in the carbon sinks [3]. Accordingly, such data demonstrate that for any CO2 reduction in the atmosphere, the emissions have to be reduced to zero for a long period. Net-zero will not reduce the existing CO2 in the atmosphere, the difficulty also being that because of deforestation, wildfires and ocean warming, less CO2 is stored in the carbon sinks. The idea of direct carbon reduction by replacing trees with machines is a nice one, but unfortunately this doesn’t count the costs for the machines and forgets that trees not only store CO2, but also supply building materials and prevent heating of our cities. Accordingly, the discussion is complicated and the concepts of net-zero and zero emissions are often confusing.
2 Cement industry projections
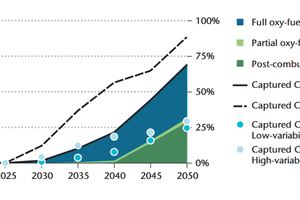
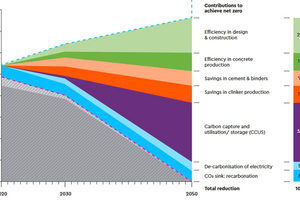
In the cement industry, the projections for CCUS have changed over the years. In a first approach, a ‘Technology Roadmap’ in year 2018 produced by the International Energy Agency (IEA) together with the Cement Sustainability Initiative (CSI) asserted that the share of CCUS systems for cement decarbonization up to 2050 would be 25% or about 450 million t CO2 capture capacity per year (Mt/a) for the 2 °C scenario limit in the low-variability case [4] with a global cement production of 4682 Mt/a (Figure 3). In recent roadmaps by cement companies and cement associations, the role of CCUS is a different one. It is propagated that with CCUS it is possible to achieve zero or negative CO2 emissions on the long-term net-zero goal in 2050. In a projection, the Global Cement and Concrete Association (GCCA) stated that CCUS systems will be responsible for 36% of the CO2 reductions by the cement industry up to 2050 (Figure 4) [5]. According to the GCCA, this percentage corresponds in their calculation to 1370 Mt/a of CO2 eliminated by CCUS systems mid-century. However, the veracity of other different pathways and high rates to net-zero are also very questionable.
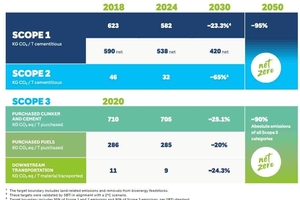
The percentage contribution of CCUS systems in the cement industry for achieving zero emissions depends largely on the conventional measures for decarbonization, such as improvement of the production process, reduction of the clinker factor in cement by substituting clinker with supplementary cementitious materials or limestone, usage of renewable energy and waste heat recovery systems, alternative fuels, digitalisation, AI and similar measures. All the different measures and CCUS systems lead to a reduction of the specific CO2 emissions. Figure 5 shows projections by Holcim, for how they plan to reduce their scope 1-3 CO2 emissions [6]. By 2030, Holcim aims to reduce scope 1 emissions by -23.3% and scope 2 by -65.0%, while scope 3 emissions should be reduced by -23.6%, based on the 2024 level. By 2050, net-zero emissions are planned, which makes it difficult to understand how this can be achieved. Anyhow, Holcim is probably at the forefront of the cement industry when it comes to a differentiation of scope 1-3 CO2 emissions.
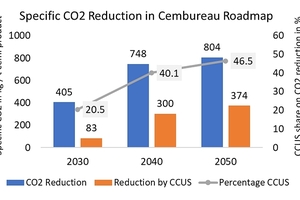
The CEMBUREAU Roadmap 2050 goes into more detail than the GCCA roadmap. The projections are based on specific CO2 emissions / t of cementitious (cem) material. For the European cement industry, a figure of 804 kg CO2/t cem material in 1990 is the basis [7]. Projections for the years 2030, 2040 and 2050 were given for how the individual measures will contribute to cement decarbonisation. Figure 6 shows the projections for the total decarbonization and the contribution of CCUS. Accordingly, the percentage of CCUS shall increase from 20.5% in 2030 to 46.5% by 2050. In the projection, on average, CCUS will decrease the specific CO2 emissions by 83 kg/t cem products in 2030, 300 kg/t in 2040 and 374 kg/t by 2050. Accordingly, the model takes into account that by 2030 the first few CCUS projects will be available leading already to 20.5% reduction, while a much higher number of CCUS plants will already be operational by 2040. The only information that is missing in these data is, how many CCUS plants will already be needed in Europe by 2040?
3 New market investigation
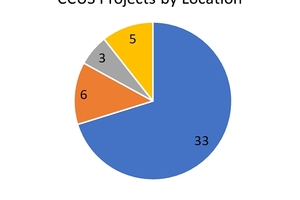
Carbon capture and CCUS projects by the cement industry will not end at European borders. Recently, a new comprehensive research report on the global situation of CCUS was released by OneStone Consulting [8] with a number of new findings. A major part was to study the commercial projects around the world and to see how much CCUS capacity will be operational by 2030. The other main questions were: is it possible to find data about the real project costs, investors, prospective suppliers and how the downstream sector for the storage of CO2 will be managed. By June this year, 47 large-scale CCUS projects were identified worldwide, which are proposed to be operational by 2030. The majority of these projects are in Europe (Figure 7), while many of them receive money from the EU Innovation Fund, amounting to about 2 bn Euro in total. The capture capacity of all worldwide projects is 41.3 Mta of CO2, which corresponds to only 1.6% of the CO2 emissions of the global cement industry. This is a fraction of the 20% projected by CEMBUREAU by 2030.
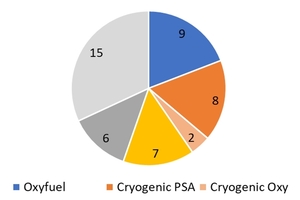
Figure 8 indicates that today 3 different technologies are mainly preferred, Oxyfuel technologies, cryogenic carbon capture with pressure swing absorption (PSA) and more conventional solvent technologies [8]. There are also other technologies specified such as membrane technologies or MOF (metal organic frameworks). Today, carbon capture and utilization (CCU) plays no major role. However, a huge number of technologies has not been specified or published. There are more than 30 different solutions offered by suppliers and they all require different investments. It is important to consider the entire costs of CCUS systems. Data provided by ECRA [9, 10, 11], CEMCAP [12] and the Global CCS Institute [13] show the capture and downstream costs from liquefaction, intermediate CO2 storage, transport, shipping and injection into underground long-term storage. At the moment, these costs are much higher than the CO2 emission taxes. CO2 taxes would have to reach € 250-350/t of cement to make carbon capture economical. To compare the carbon capture costs, flue gas purification and energy costs for operating the systems need to be included.
4 Projections by 2050
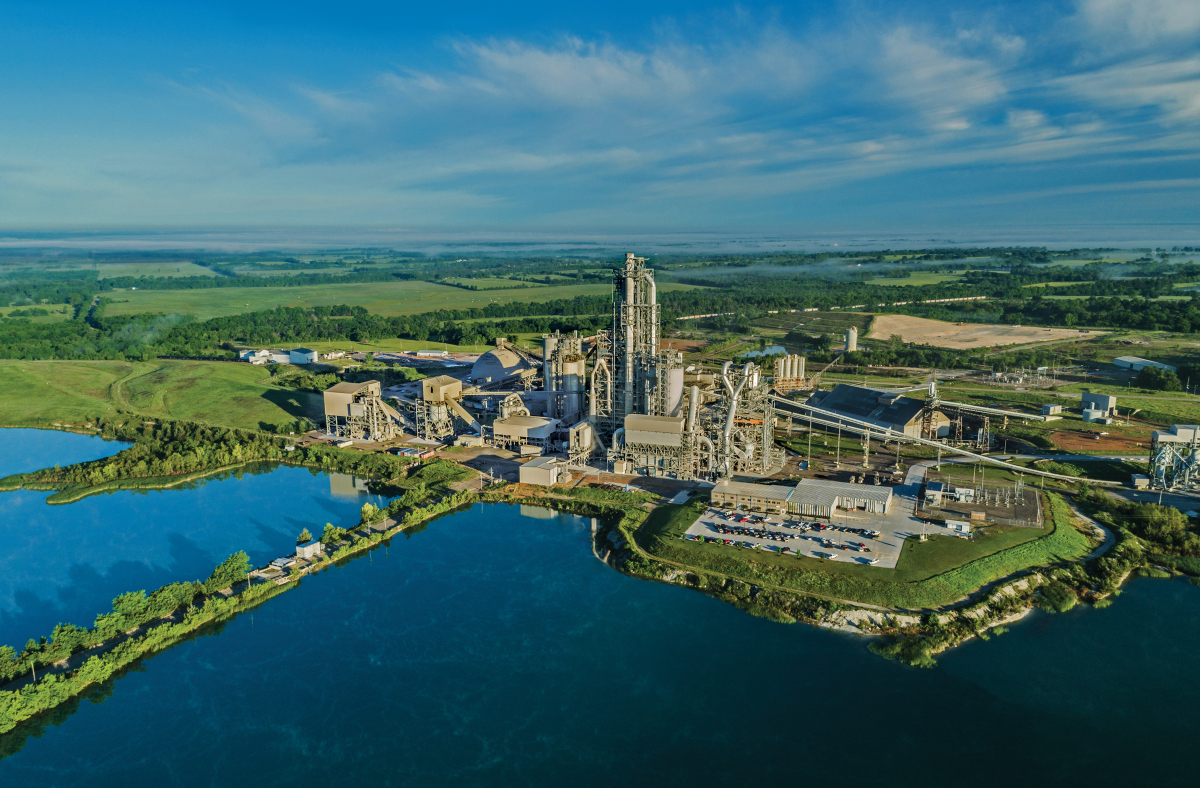
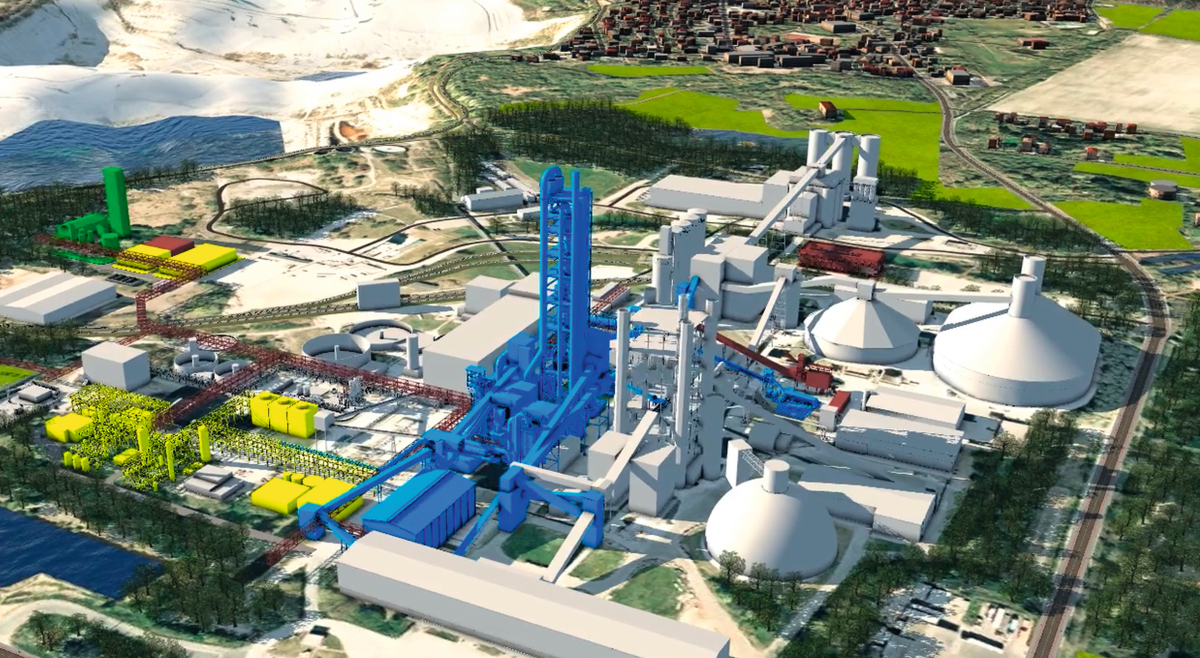
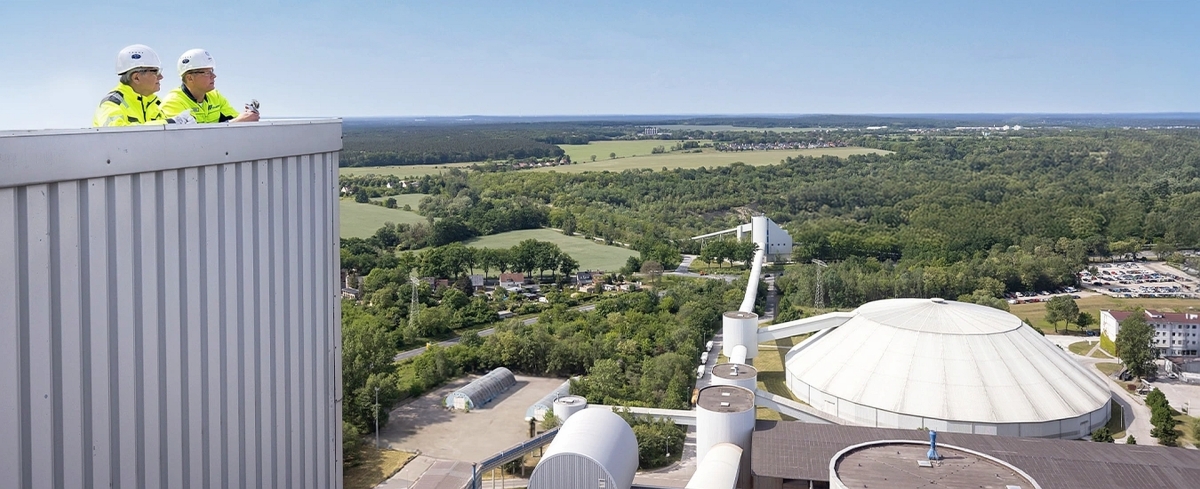
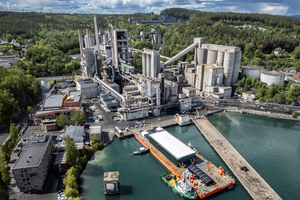
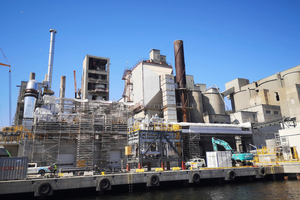
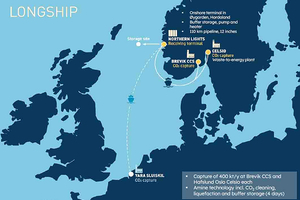
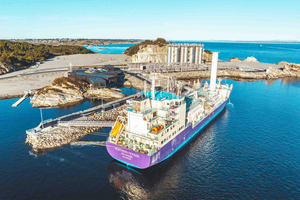
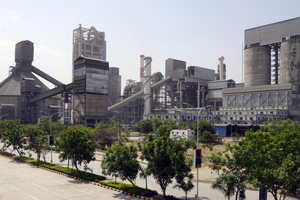
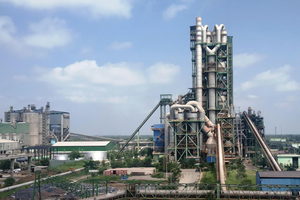
Up to now, the Brevik cement plant in Norway (Figure 9) is the first commercial CCS plant capturing CO2. Many data about the project development and performance have been provided [14 to 17]. The Heidelberg Materials’ Brevik plant has a 4.4 m diameter and 68 m long kiln with a capacity of 3300 t/d. The CO2 emissions of the plant were already reduced by 22% from 1990 to 2019. With increasing alternative fuels and new cement products, the company planned to further reduce CO2 emissions by 11% up to 2030, not including the installation of the CCS plant. Anyhow, the CCS plant is designed for the capture of about 50% of CO2 from the cement plant, corresponding to about 0.4 Mt/a of CO2 or 50 t/h [18]. The Brevik plant has four CO2 buffer storage tanks with 5000 m3 capacity in liquefied state (16 bar, -26 °C) for up to four days storage to reload the CO2 to 7500 m3 carriers with loading rates of 800 t/h. In the Longship project (Figure 10), two CO2 carriers are used to transport the CO2 from the cement plant to the Northern Lights receiving terminal (Figure 11) for final sequestration of the CO2 under Norway’s shelf. Background details about transport by CO2 carriers can be found in [19].
Accordingly, today only one commercial CCUS plant is operational in the cement industry, capturing 0.4 Mt/a CO2. In the market report [8] by OneStone Consulting, details for 47 projects are given, resulting in 41.3 Mt/a captured CO2 in the best case, if all plants are operational by 2030. OneStone provided a ‘Blue’ and ‘Green’ scenario for the future of CCUS systems in the cement industry (Figure 11). In the ‘Blue’ scenario for decarbonization, the ‘low hanging fruits’ are used to a large extent, because these measures can also decrease cement production costs, while using alternative fuels, reducing the clinker factor with higher amounts of supplementary cementitious materials (SCMs) and using digitalisation and AI systems to produce appropriate products. However, due to the high investment costs for CCUS systems and declining funding schemes, the number of new CCUS systems will grow at a slower pace and the systems will only achieve a 10% share in decarbonization by 2050. Accordingly, the cement production will still emit 31% of CO2, leading to a gap of about 765 Mt/a of CO2 still emitted to the atmosphere by the cement industry in 2050.
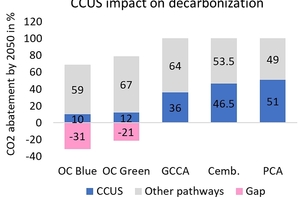
Figure 12 shows how the OneStone Consulting projection compares to the mostly applied projections. While the CCUS measures are critical in the path to net-zero in the projections by the GCCA, Cembureau and American Cement Association (PCA), the OneStone Consulting (OC) projections find that by 2050 the CO2 emissions will not be reduced to zero. According to the ‘Blue’ scenario there is still a gap of 31%, while in the ‘Green’ scenario this can be reduced to 21%, but mostly by the other decarbonization pathways and not by CCUS. Let us also keep in mind that for a net-zero case the IEA projected that 170 Mt/a of CO2 needs to be captured by CCUS systems in 2030, but according to the IEA only 20 Mt/a will actually be achieved by the cement industry, while 480 Mt/a need to be captured by 2040 and 1310 Mt/a by 2050. Similar results can be found in the cement industry net-zero tracker of the World Economic Forum. Low-emission clinker production accounted for less than 1% of total production worldwide in 2022. The cement industry’s absolute emissions have seen a 4% decline from 2019 to 2023, driven by a 3% decline in demand for cement. The share of low-emissions fuel in thermal energy use currently accounts for only 5% of the total production [20].
The major findings of the OneStone Consulting market report are [8]:
In the best case, by 2030, about 41.3 Mt/a of carbon capture capacity will be globally operational in the cement industry. This is a major achievement, but is much less impressive when compared to the 170 Mt/a projected by the IEA as required for net-zero
The analysis up to 2050 comes to the conclusion that just 10-12%, or 245 to 290 Mt/a of the carbon emissions from the cement industry, will be captured by CCUS systems (operational capacity) compared to projections by the GCCA who forecast 850 Mt/a (36%) or CEMBURAU with 1445 Mt/a (46.5%)
According to a ‘Blue’ scenario projection by 2050, countries in the EU will operate 105 Mt/a CCUS capacity, followed by China (65 Mt/a), RoW (30), MENA and North America (20 Mt/a each). The MENA region will provide this capacity mainly for clinker exports to the EU under CBAM rules
To make CCUS systems economical, carbon taxes of about € 350/t CO2 are required. Even when the CCUS systems achieve CO2 avoidance costs of € 120/t CO2, a cement production that uses primary measures to reduce emissions can be more economical. If CO2 taxes increase to € 600/t CO2, CCUS systems become the main choice. This will lead to cement prices of € 420/t, but is not very realistic
CCUS systems require high costs for the installation of the system, operation, liquefaction of the CO2 and storage underground. The utilization of the CO2 mainly requires ‘green’ hydrogen, which is up to now mostly too costly to produce. Therefore, CCUS can only attain the status of a secondary system
5 Reality check
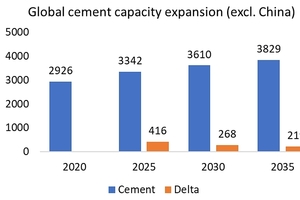
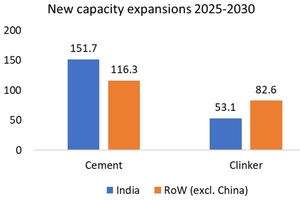
According to OneStone Consulting, in the best case 41.3 Mt/a of carbon capture capacity could be operational in the cement industry from 2025 by 2030. According to the CCF2Up market report [22], in the same period, 268 Mt/a of new cement capacity will become operational worldwide, excluding China (Figure 13). In the complete period from 2020 to 2035 the new capacity is an immense 903 Mt/a. The data up to 2025 are from project knowledge, the data to 2035 are from project knowledge and extrapolation, taking GDP growth, per capita consumption, cement demand and capacity utilization into account. Europe and North America only have a small impact on the data because they are only responsible for 5.9% of global cement production and their capacities are almost stagnant. From 2025 to 2030 the largest cement capacity expansions are in India (Figures 14 and 15) with 56.6%, followed by Africa with 11.8%, SE Asia with 8.5%, Middle East with 7.3% and Latin America with 6.2%. This accumulates to 90.4% of the new capacities. The projections for 2035 show that by then this will not change significantly, with India being the leading country/region, followed by Africa and SE Asia.
More interesting is a calculation of the new clinker capacity, because clinker production is responsible for 2/3 of the carbon emissions from the cement industry, due to the limestone conversion to clinker. In India only about 35% of the new cement capacities require new clinker capacities, due to the extended use of cementitious products, while in the rest of the word (excluding China), about 71% of the new cement capacities require new clinker capacities (Figure 16). Accordingly, the data from above for the period from 2025 to 2030 will lead to new clinker capacities of 135.8 Mt/a. With an average carbon footprint of 650 kg CO2/t cement, this alone contributes to 83.7 Mt/a of new carbon emissions by 2030 if the plants are fully operational, while 41.3 Mt/a will be reduced in the best case. When we continue the projection from 2030 to 2050, about 450 Mt/a of new clinker capacity will be installed, contributing to 292 Mt/a of additional CO2. This is coincidentally almost the same amount of CO2 that is captured by 2050 in the ‘Green’ scenario by OneStone Consulting.
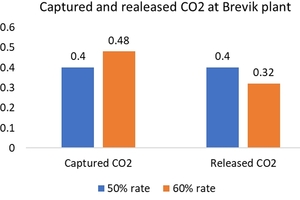
How easy is it to achieve net-zero emissions from a cement production which is not carbon-free? If you follow the arguments by Heidelberg Materials and their evoZero® product, it should be possible [23]. But isn’t this absurd? Heidelberg Materials is using the Brevik CCS example, where as from 2025 about 50% of the produced CO2 is captured. Two main cements are produced, with carbon emissions of 765 kg CO2/t cement in the CEM I case and 568 kg CO2/t cement in the CEM II B-M case. However, even if the CCS system reduces not 50% but 60% of these emissions (Figure 17), 0.48 Mt/a of CO2 are captured, while 0.32 Mt/a are still released to the atmosphere. The cement from the plant is not carbon-free. The net-zero claim is based on a mass-balance allocation approach of carbon savings from Brevik’s CCS facility as well as downstream carbon savings over the whole product lifecycle achieved through natural re-carbonation. Probably this requires a period of several hundred years to become true, but does not help us now in decarbonization and net-zero and also fuels the discussion about future natural carbon sinks and how net-zero and re-carbonation need to be verified.
6 Market outlook
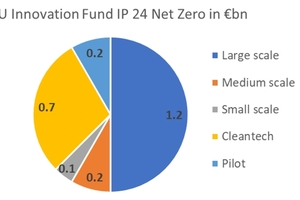
In the last few months, it has become very quiet with regard to new commercial CCUS projects worldwide [24]. Currently, there are no open EU Innovation Fund calls for project proposals. The European Commission launched 2 calls for proposals and an auction under the Innovation Fund in December 2024. This was the IF24 call with € 2.4 bn available for net-zero technologies and the IF24 battery call with € 1 bn available for electric vehicle battery cell manufacturing. Together, both calls received a total of 373 project proposals. 359 project proposals were for the net-zero call which collectively sought € 21.7 bn in support, highlighting a demand that surpasses the available budget of € 2.4 bn by more than nine times [21]. There are 5 budget categories, (Figure 18). Large scale projects with a CapEx above € 100 m will receive 50% of the budget. Which of these projects are from the cement industry has not been published. Grant awards will be announced in Q1 2026. The situation in the USA is even more difficult. The Trump administration has cancelled the DOE awards totalling US$ 3.7 bn that were announced during the Biden administration to support various carbon capture and decarbonization projects by the cement industry.
The world can be divided into Global North and South with large disparities. The roadmaps by the cement industry are misleading. It has been claimed that zero cement emissions will be achieved with CCUS by 2050. There is no evidence that this can be achieved, especially in the countries of the Global South. The identified 47 commercial projects are far away from what has been projected by the IEA up to 2030. Intensive funding is becoming restricted. There are many open problems including infrastructure, CO2 highways, dedicated CO2 carriers and high costs for CO2 injection into depleted oil & gas wells or aquifers. It is necessary to calculate the energy and transport costs to capture and sequester CO2. Accordingly, the roadmaps by the cement industry need to be rewritten based on what is possible in reality and what is impossible. The global data and especially data for developing countries need to show how much clinker will be produced by how many clinker plants in the coming years and how many CCUS systems are realistic. Whenever budgets are stated, it should be shown that the money for the budgets is actually allocated.
At the moment, OneStone Consulting is working on a project for an Asian investor in the MENA region. The company wants to decide if it is feasible to invest in a cement plant with integrated CCS system in that region. A large part of the produced clinker could be exported to the EU under the CBAM scheme, while a smaller portion could be produced for local green cement. The MENA country could become a partner country for the EU, which also allows for a carbon credit scheme. Furthermore, it is realistic that several EU cement producers will stop producing clinker, because the EU plans to reduce net greenhouse gas emissions by 90% by 2040, compared to 1990 levels. However, this does not mean that family businesses will give up their complete cement business. In the coming years, there will be a growing need for CO2-free clinker imports. CCS-based production plants in the oil producing countries in the MENA region can supply the clinker. The CO2 storage costs are relatively small. Compared to EU countries, they are also able to produce clinker at lower costs. Trade without borders will drive sustainable development.