A novel approach in the assessment of carbonate rock types for calcination in modern vertical kilns in Southern Africa


The shift to modern vertical kilns in recent projects has placed the focus on feed stone characteristics. To set criteria for assessment, a range of analytical, visual and thermal investigative methods was tested on high-grade limestone and dolomite from three different regions. The interpretation of results demonstrates the ability to determine differentiating stone properties for correlation with kiln operation.
1 Introduction
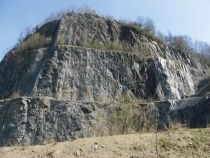
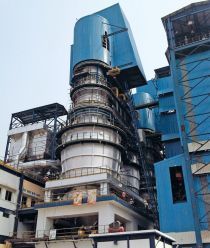
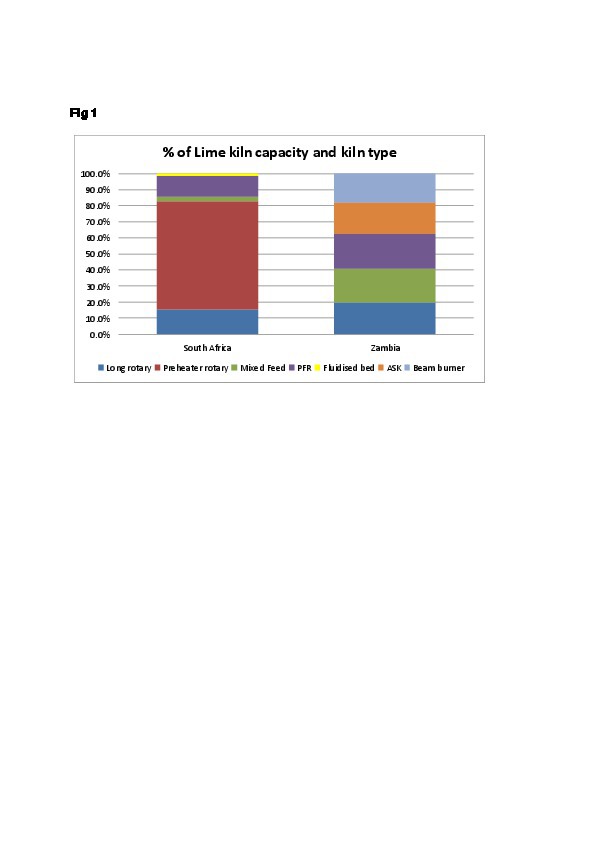
In Southern Africa, the most recent large-scale lime kiln projects have seen the installation of modern vertical kilns instead of rotary kilns which have mainly been used since the mid-1950s. Lime production in the region is concentrated in South Africa and Zambia where lime capacity developed historically to meet the needs of the mining and metallurgical industries. The total lime kiln capacity in South Africa and Zambia is estimated at 8540 and 2800 t/d respectively, and a breakdown of capacity per kiln type is presented in Figure 1. In South Africa, rotary kilns currently account for about 82 % of total kiln capacity while Zambia has a more evenly distributed capacity per kiln type.
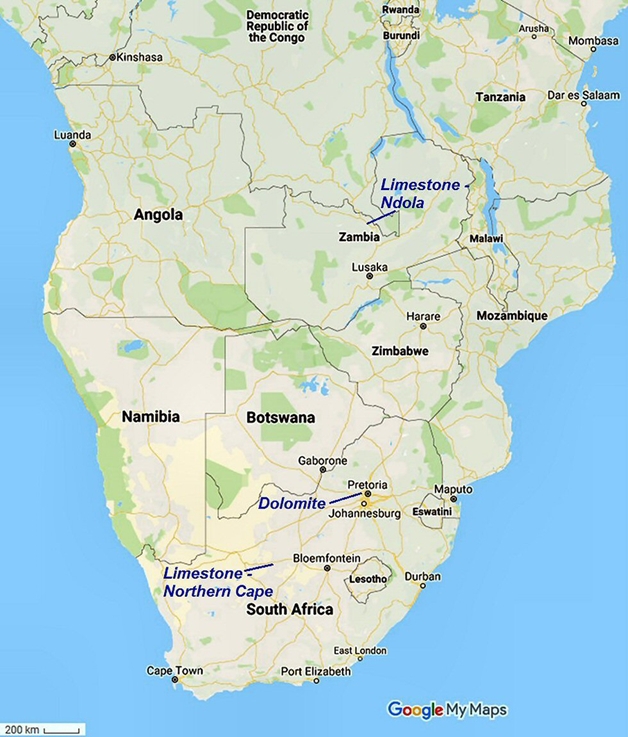
The largest South African limestone deposit, in the Campbell Rand subgroup (part of the larger Transvaal supergroup), is in the Northern Cape province [1]. Extensive deposits of dolomitic limestone are located in the Gauteng province, in the Malmani subgroup. In Zambia, the major limestone deposits occur around Ndola in the Copperbelt province, in the Kakontwe formation [2]. As indicated in Table 1, these deposits include some of the oldest carbonate platforms in the world [3].
It has been found that with certain new vertical kiln installations, despite the established standard tests being performed by kiln suppliers, kiln operating problems have occurred unexpectedly during the commissioning and early operating stages. These are often attributed to the feed stone characteristics which can influence the working of a lime kiln significantly [4], [5]. Lime kiln design is refined on the basis of the results of empirical tests and careful analyses of the quality of the limestone [4], [6]. Bresciani and co-workers [7] suggest that solutions needed by the lime industry in this regard require a combination of data from different specialities including geology, mineralogy and crystal chemistry.
In previous publications, several authors covered the different assessment methods and techniques used to describe carbonate rock characteristics [4]-[6], with laboratory techniques well summarised [4]. In [6] focus was placed on the chemical, mineralogical and petrographic properties of carbonate rocks for assessment of suitability and prediction of lime reactivity. The same research introduced the importance of the groundmass of the stone and its influence on stone characteristics. In [5] thermal analysis was added to the existing characterisation scope with a focus on how thermal behaviour affected lime and hydrated lime products.
This research significantly extends the range of tests normally used in the lime industry for assessment of carbonate rock (Table 2). It applies new and established assessment methods to samples of limestone and dolomite from three geographic regions (Figure 2), to determine the suitability of these methods to evaluate stone for use as feed in vertical kilns. Focus is placed on the ability to differentiate between the properties of stone from different sources. The range of analytical, visual and thermal investigative methods includes X-ray Fluorescence (XRF), X-ray diffraction (XRD), Scanning Electron Microscopy (SEM), Raman spectroscopy (RS), Single Particle Analysis (SPA), Petrography, Decrepitation tests (DT) and Thermogravimetry (TG).
2 Methodology and experimental
2.1 Stone samples
Stone samples were collected from three different regions, and the origin and designated sample nomenclature is provided in Table 3.
2.2 Experimental procedure
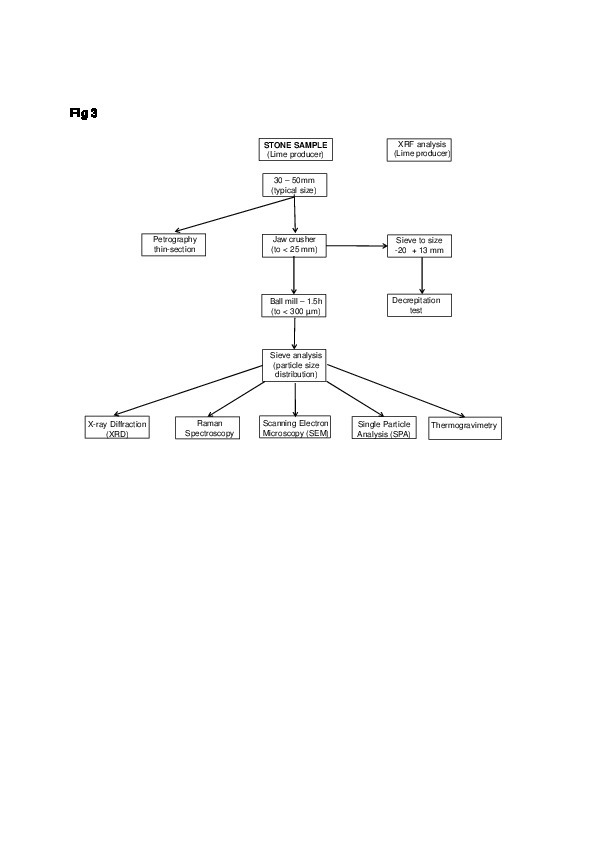
The sample preparation and analysis methods are set out in Figure 3.
2.2.1 Sample preparation
Before analysis, the stone samples (typically 30-50 mm in size) needed to be prepared specifically for the analysis method. Samples were sectioned into thin layers for the petrography analysis. For all other analyses, the as-received stone samples were first crushed in a jaw crusher to reduce the particle size to less than 25 mm. For the decrepitation test, the crushed sample was screened into a 13 – 20 mm size fraction. For tests requiring a powder sample (XRD, Raman, SEM, computer controlled SEM (CCSEM) and TG) a portion of the crushed sample was milled to a size of -300 µm in a stainless steel ball mill (175 mm diameter x 220 mm length) for 1.5 h with a standard laboratory charge of stainless steel balls. After milling, a sieve analysis was done to determine the particle size distribution of the powdered sample.
2.2.2 Analysis methods
The XRF analysis results for samples W, X and Y were obtained from the analytical laboratory of each lime producer. The XRF analysis of Sample Z was performed on a Panalytical PW2404 x-ray fluorescence spectrometer in the School of Geosciences at the University of the Witwatersrand.
The thin stone sections, used for Petrographic analysis, were analysed and photographed using an Olympus BX41 petrographic microscope with an Olympus DP26 camera attachment. The micropetrography of each thin section was described in terms of mineralogy, grain size, grain contacts and relative abundance using visual estimation.
For the decrepitation test, a 250 g sample of screened stone (13.2 – 20 mm) was heated to 1050 °C and held at this temperature for 60 min. After cooling to 115 °C, the sample was placed in a desiccator for further cooling to ambient temperature and then weighed. The sample was then screened at 11.2 mm and the fines were collected and weighed. The %-decrepitation was calculated from the weight ratio of the screened fines to the calcined sample.
XRD analysis was performed using a Bruker D2 Phaser desktop diffractometer.
Raman analysis was carried out on two separate instruments, a Renishaw inVia Raman microscope or a ThermoFisher DXRTM 2 Raman microscope, depending on the sample. For the Renishaw inVia Raman analysis, a thin layer of powder was applied to a microscope slide and 20 arbitrary points analysed for each sample. Spectra were collected over the range of 100-1200 cm-1 with an exposure time of 10 s and 20 accumulations. For the DXR Raman analysis, a digital map of 5 points on each sample was made and 10 spectra were collected automatically from each point with the use of an automated sample table.
Scanning Electron Microscopy samples were prepared by lightly dabbing a sticky carbon stub on a surface with evenly spread sample. Excess sample was removed by blowing air over it, leaving a thin layer of the sample on the stub. Due to the low conductivity of limestone, carbon stubs containing the limestone powders were each covered with a very thin layer of gold and palladium to increase conductance. A Carl Zeiss Sigma 300 FESEM instrument equipped with integrated Oxford X-act EDX detection was used for SEM. Images were captured at 1000 and at 4000 magnification.
For CCSEM, single particles need to be visible to the EDX for analysis. In order to obtain evenly spread single particles on the carbon stub, a suspension of sample in methanol was prepared and 1-2 drops were placed on a stub containing black carbon tape. The methanol evaporated leaving behind dispersed particles. In the suspension, larger particles sank to the bottom leaving mainly smaller particles to be drawn up in the pipette. Consequently ±90 % of particles presented for single particle analysis were sized below 10 µm. The SEM images of CCSEM analysis were captured by a Carl Zeiss Supra 40VP instrument and SmartSEM software. The EDX analysis was performed by an EDAX Apollo 40 SDD instrument and Genesis software. The “single particle analysis” application of the EDAX Genesis software was used to analyse the chemical composition of each individual particle. The microscope settings were 25 kV acceleration voltage and 15 mm working distance, with 15 s spectrum recording time for each particle.
Thermogravimetric analyses were performed on a TA Instruments SDT Q600, with a horizontal balance and furnace. A sample mass of 10 mg was used for each TG run and the heating rate was set at 15 °C/min, aligned with established procedure [9], [10]. Dolomite (W) decomposition was observed at temperatures, 850 °C, 900 °C, 950 °C and 1000 °C at a CO2 partial pressure of 0 bar (pCO2 = 0 bar). At pCO2 = 1 bar dolomite decomposition could not be observed below 950 °C, and hence decomposition was studied at temperatures between 950-1150 °C with 50 °C intervals. The thermal decomposition of the limestone samples (X, Y and Z), at pCO2 = 0 bar and pCO2 = 1 bar, was observed with final decomposition temperatures between 950-1150 °C with 50 °C intervals. In the case of sample Z, total sample decomposition could not be observed at pCO2 = 1bar and 950 °C.
3 Results and discussion
In assessing the properties of carbonate rock for processing in vertical kiln installations, a number of analytical methods was applied, using [4] as a guideline for selecting suitable techniques and tests. Raman spectroscopy (RS) was chosen as a complementary technique to XRD in order to identify phases present in proportions below 5%. Computer Controlled SEM (CCSEM) was utilised for Single Particle Analysis (SPA) and the Kandler method was applied to interpret the SPA results [8].
3.1 Assessment of elemental composition
and phases present in carbonaceous stone
XRF, in conjunction with XRD, Raman spectroscopy and SPA, was used to determine the elements present in each sample and further to assess the phases in which the elements are present. Powdered samples of each stone type were prepared and the average particle sizes are presented in Table 4.
What is interesting to note from Table 4 is that dolomite is softer than limestone as similar milling times gave substantially smaller average particles. The hardness of stone indicates a resistance to abrasion and for minerals can give an indication of potential losses from dust formation. The elemental composition results from the XRF analysis are set out in Table 5. Limestone samples (X, Y and Z) contain mostly CaCO3 while the dolomite sample consists of a combination of MgCO3 and CaCO3 with some other minor elements. The presence of MgCO3 appears to soften the mineral. The manganese and iron content in samples X and Y is in accordance with observations made by [11], that “The Ghaap Plateau facies carbonates are relatively manganese-rich containing more manganese than iron”. Of the three limestones, sample Z contains the highest level of silica and alumina. The high level of silica in sample Z is attributed to the sandstone and siltstone in the upper Kipushi formation and lower Kaponda formation [2]. Sample Z contains a similar amount of iron to samples X and Y but less manganese.
XRD and Raman spectroscopy were used to identify the phases present in the stone samples and results are given in Table 6. The Rietveld method was applied to quantify the amount of each phase from the XRD data while Raman spectroscopy was used to qualitatively identify trace phases which XRD cannot identify.
The two main Raman matches for sample W were magnesite (MgCO3) and dolomite (CaMg(CO3)2). FeCO3 (siderite) makes up 0.52 % (equivalent to 0.25 % Fe) according to the XRD data. However, according to the XRF results, sample W contains a total of 0.78 % Fe2O3 (equivalent to 0.54 % Fe) – therefore leaving 0.29 % of iron present in phases/minerals other than siderite. The other possible phase is pyrite which was identified by petrography and estimated to be present as <1%.
For sample X, the amount of SiO2 determined by XRD (0.77 %) is more than what is reported in the XRF results (0.21 %). This can be attributed to the fact that SiO2 is not distributed uniformly throughout the sample. SiO2 can occur as pure quartz or as part of a complex mineral. Raman spectroscopy is of value when it is necessary to establish whether SiO2 occurs as pure quartz, as a mineral/clay or as quartz together with a mineral/clay. As shown in Table 6, quartz was not identified in sample X by Raman analysis. Since 20 points were analysed on the Renishaw inVia Raman spectrometer and not one contained a quartz phase it can be said with confidence that SiO2 occurs in a mineral/clay form (alumino-silicates) in sample X. Thulite was identified by Raman spectroscopy as the only Si-containing mineral and it is therefore concluded that Si occurs only as thulite in sample X. Thulite is the source of not only silicon but also of manganese in the sample. Magnesium occurs as two minerals in sample X – ferroan dolomite and fluoborite. The presence of ferroan dolomite in the sample source area is confirmed by [11].
The Raman spectra of sample Y matched with calcite, fluoborite, and thulite. It cannot be said with certainty in which phase the Si in sample Y occurs. The SPA results proved, however, that most of the Si occurs as alumino-silicates. No iron-containing phase was matched to the Raman spectrum of sample Y. XRF and SPA results proved, however, that Fe is definitely present in sample Y and this is confirmed by [12]. It is therefore unclear in which mineral form Fe occurs in sample Y. The thulite in sample Y is the phase that contains the Mn identified by XRF analysis.
Sample Z spectra matched the phase spectra of calcite, aragonite, fluoborite, libethenite, graphite and quartz. The presence of quartz, graphite and libethenite is explained by [2]: “Sulphide-rich carbonaceous beds (pyrite and chalcopyrite) and a 10m-thick conglomeratic sandstone bed occur at the base and top of the formation, respectively. Quartz (11–12 vol.%), granite (7–9 vol.%), dolomite (4–6 vol.%), quartzite (3–4 vol.%), sandstones (1–2 vol.%), feldspar (0–1 vol.%) and mica schist (0–0.6 vol.%) clasts are randomly distributed in a dolomitic or carbonaceous shale matrix…In the Kipushi Pb–Zn–Cu mine, the Mwale formation contains sulphide-rich veinlets cutting across-bedding in shale beds.” The reason for the occurrence of Fluoborite is not certain since the Magnesium-containing phase in the Kakontwe limestone is dolomite [2], [13], [14]. The presence of Aragonite could not be confirmed in the TG.
Despite the XRF results indicating the presence of Iron in sample Z, no iron phases were identified during Raman spectroscopy. The iron in sample Z identified by XRF analysis most likely occurs as iron oxides [2].
In addition to XRF, XRD and Raman spectro-metry, single particle analysis was also performed. The value of SPA is realised when using the Kandler method of interpretation. This method uses ratios of elements in order to predict the compound in which those elements occur, for a defined particle [8]. The Kandler method does not merely take into account the elements that make up the compound, but also recognises the amounts of other elements that are present, normally excluding C and O occurring in the sample. As an example of the Kandler application, the element ratio criteria for gypsum are: |Ca+S| > 0.5 and 0.25 <Ca/S < 4 and Na/Ca < 0.5 [8].
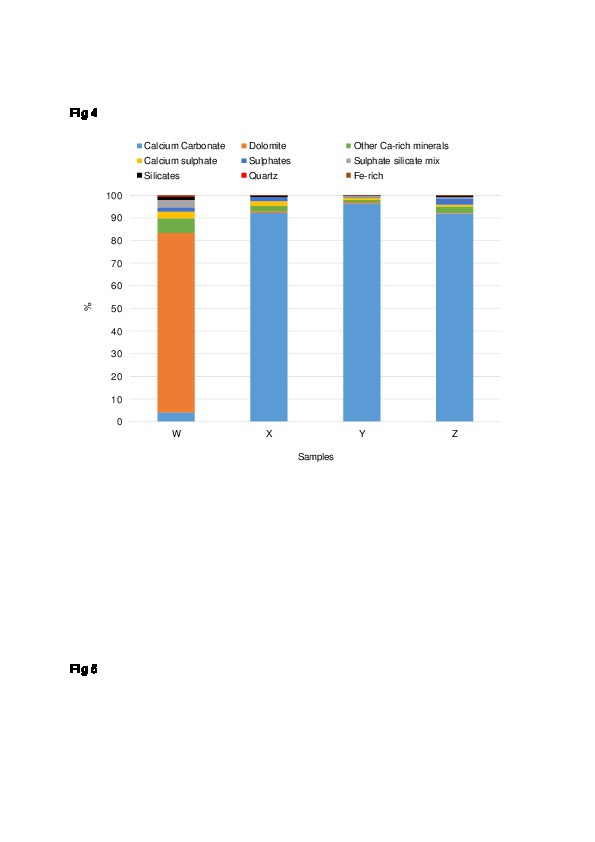
The results from the Kandler interpretation of the single particle analysis (SPA) outcome are presented in Figure 4. The amounts of certain compounds differ from the XRF and XRD results due to the way in which the Kandler method interprets compounds and due to distribution of minerals upon milling. The Kandler method, however, is utilised as a complementary method in interpreting experimental results.
As stated in the experimental section, when preparing samples for SPA analysis, the larger particles settled in the methanol solution and hence SPA was performed predominantly on particles in the -10 µm size range. Three important facts should therefore be borne in mind when studying the Kandler interpretation of the single particle analysis (SPA):
(i) The relative contribution of sulphates and carbonaceous material increases with decreasing particle size [8]
(ii) Alumino-silicate clay minerals occur to a large extent as a dispersion of sediment of 0.1 – 10 µm particles concentrated in small size fractions (below 20 µm) [8]
(iii) Silica in the form of quartz and carbonates, chiefly calcite, ankerite and siderite, shows enrichment in the particle size range 20 – 75 µm [17]
Sample W consists primarily of dolomite (80 %). This is in agreement with the XRF and XRD analyses. The significant presence of calcium carbonate (calcite) does, however, not agree with the XRD/Raman spectroscopy results and the reason for this is resolved by (iii) above.
The 1.5 % level of silicates identified by the Kandler method is aligned with the 1.26 % of SiO2 reported by the XRF analysis. The 0.3 % quartz is lower than the amount of quartz identified in the XRD analysis (2.7 %). The reason for this was explained by Kandler et al. in the statement “the same silicate minerals dominating the silicates class were mixed with the materials dominating the other classes”. Therefore silica occurs as iron- and alumino-silicate minerals in the “silicates” class instead of as quartz in the “quartz” class [8].
As expected from a high purity limestone, sample X consists mainly of CaCO3. The occurrence of dolomite is indicated in the SPA results (0.7 %) but this does not disprove the possible presence of Mg in fluoborite form (Mg3(BO3)(F,OH)3) as identified by Raman spectroscopy. The presence of fluoborite could, however, not be confirmed as the Kandler interpretation did not account for borates. XRF analysis reported 0.1 % Si and 0.02 % Al in sample X. The low percentage of “sulphate silicates” but higher percentage of “sulphates” in the Kandler interpretation indicates that silicates do occur but not in combination with sulphur. The low quantity of “quartz” (0.1 %) compared to the higher 0.4 % “silicates” supports the deduction made in the XRD/Raman section that Si is present chiefly as aluminosilicates and these are present as the mineral thulite.
The Kandler interpretation of Sample Y is dominated by “calcium carbonate” (96.4 %) which is in the calcite phase according to the XRD analysis. The high occurrence of sulphate in 0.6 % “sulphates” and 0.9 % “calcium sulphate” is supported by (i). Dolomite does occur in the SPA results of sample Y (0.5 %) but this alone does not disprove the presence of Mg in fluoborite form. The Kandler interpretation that was used did not account for borates and therefore an accurate determination of the presence of fluoborite could not be made in this case. XRF results reported 0.03 % of Si and 0.01 % Al in sample Y. Both the Si and Al XRF values for sample Y are half those of sample X. This fact is reflected in the Kandler “silicates” and “sulphates” which are half and less than half for Sample Y as compared to sample X. It is therefore suspected that the higher than expected 0.2 % “silicates” and 0.2 % “sulphate silicates” resulted for the reason given by (ii).
Limestone sample Z also consists mostly of CaCO3 (92 %). XRF results reported 0.97 % MgCO3 in sample Z. The 0.2 % “dolomite” class is most likely a trace phase in the sample and the phase in which some of the Mg occurs. However, Raman results indicated the occurrence of Mg in the fluoborite phase. 0.4 % “sulphate silicates” and 0.5 % “silicates” in Figure 4 confirm that Si and Al occur as alumino-silicates in sample Z – likely as illite or chloritoid. Although no Al-containing phases were identified in sample Z, it is known that plagioclase (NaAlSi3O8 - CaAl2Si2O8) occurs in the Kaponda formation which is situated below the Kakontwe formation in which sample Z occurs [2]. The absence of Na in the XRF results indicates that if plagioclase occurs in the sample, it is probably present as pure anorthite (CaAl2Si2O8). Anorthite is a calcium alumino-silicate and the presence of alumino-silicates in sample Z is therefore confirmed.
3.2 Physical characteristics of stone samples
The physical characteristics of the stone samples were observed and assessed by SEM, petrography and decrepitation tests. Decrepitation served both as a physical test of the structural integrity of the stone as well as an assessment of stone behaviour in a high temperature environment. Petrographic information was used extensively to explain decrepitation observations.
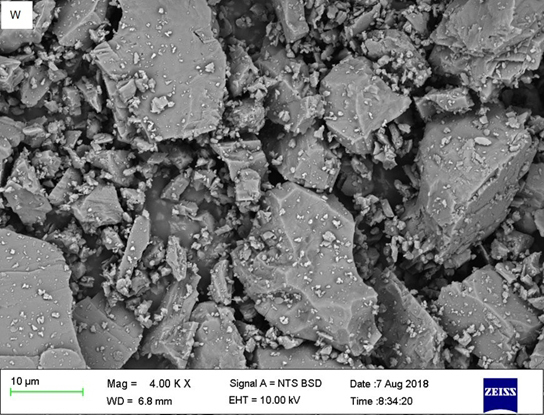
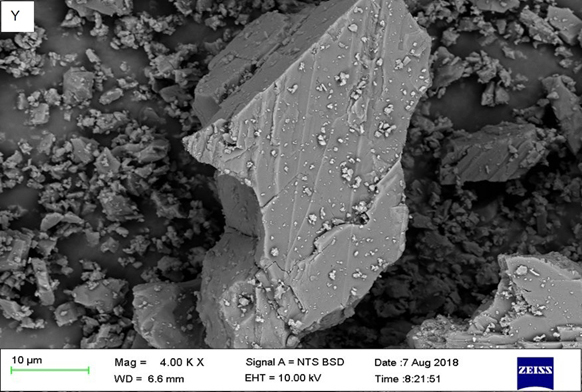
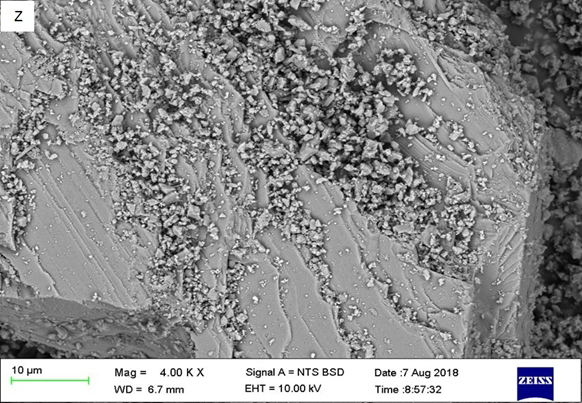
Figure 5 shows sample SEM images taken of the powdered stone samples under investigation.
These images were studied, and the carbonate rock samples were classified based on the grain characteristics that were observed from them. Table 7 shows the results and interpretation for the analysis.
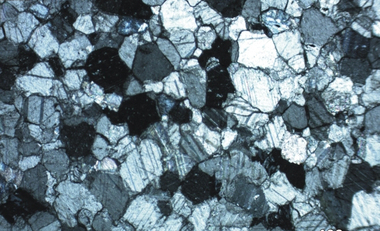
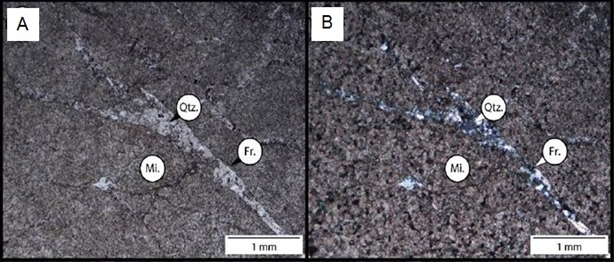
Petrography is concerned with the description and study of rocks through the analysis of microscopic images. Thin slices of stone samples were prepared and petrographic microscope images such as the ones shown in Figures 6 to 9 were captured and analysed.
Figure 6 shows a quartz vein infill (Qtz.) within fracture (Fr.) and the overall micritic (Mi.) nature of the dolomite sample in plain polarised (A) and cross-polarised (B) light.
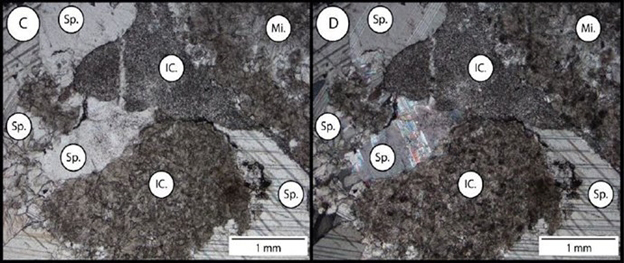
Figure 7 shows the relationships between a micrite matrix (Mi.) and sparite infilled fenestrae (Sp.) in limestone sample X obtained from the Northern Cape in plain polarised (C) and cross polarised (D) light.
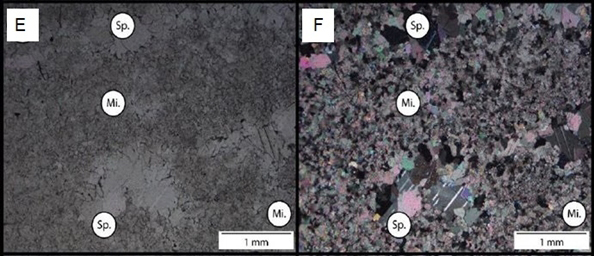
Figure 8 shows the relationships between micrite matrixes (Mi.) and sparite infilled fenestrae (Sp.) in limestone sample Y in plain polarised (E) and cross polarised (F) light.
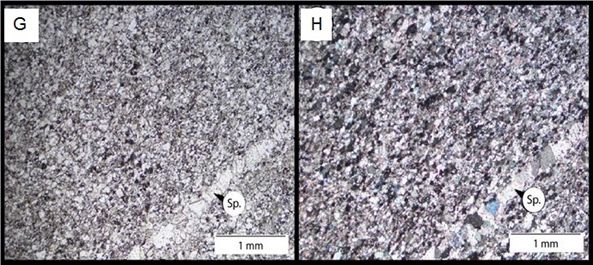
Figure 9 has images of a thin section of limestone sample Z showing the fine-to-medium grained nature of sparry calcite ground mass, with primary ripple cross-laminations and sparry calcite infilled (Sp.) oriented subparallel to laminations (black dashed lines) in plane polarised (H) and cross-polarised light)
Table 8 provides the results of the analysis of the petrographic microscope images with a summary of the petrographic features observed for the different carbonate rock samples.
The decrepitation characteristic of a stone is an essential parameter in assessing the suitability for calcination in a lime kiln. Decrepitation of stone in shaft kilns can cause channelling and consequently problems with product quality. Decrepitation in rotary kilns causes dust formation, resulting in loss of production mass. Levels of decrepitation for calcined stone have been classified following the ratings used in [6] for “degradation”, as illustrated in Table 9.
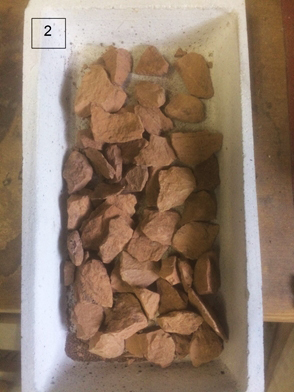
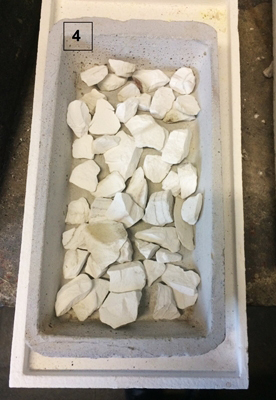
Figure 10 shows images of limestone samples X (1 and 2) and Z (3 and 4) before (1,3) and after (2,4) calcination. The calcined sample (2) of limestone X exhibits the distinctive brown colour of lime produced from the Northern Cape limestone due to the presence of manganese in the stone.
The decrepitation behaviour of a stone can be linked to its petrographic properties. Table 10 shows combined petrographic characteristics and the decrepitation value of each stone. The decrepitation test results were evaluated by reference to the petrographic analysis and previously published data.
The petrographic analysis of sample W showed that it is a micrite consisting of 85 – 95 % micrite (“mud”). Primary pores are absent, but secondary pores are present as thin fractures often occupied by quartz or micrite. The decrepitation result can therefore be interpreted as follows: The absence of calcite crystals is the reason for the low amount of decrepitation [18]. The micrite grains do not expand and break up as would occur with crystals and the rock is therefore less susceptible to decrepitation [18]. The micrite “mud” grains expand and contract as a matrix, keeping the structural integrity of the stone intact. Large micrite grains are more likely to crumble upon calcination, contributing to decrepitation. Secondary pores that are filled with silica/quartz prevent the expansion of grains and would increase decrepitation.
Petrographic results showed that samples X and Y are dismicrite rocks, sparite crystals surrounded by micrite “mud”. The sparite exists as a mosaic of 0.3 – 1.8 mm coarse crystals in interconnected primary pores in both samples. These crystals expand upon heating and shrink upon calcination. The decrepitation tests for samples X and Y thus compared as follows. The calcite crystals in the stone contribute towards decrepitation [18], but the fact that the crystals are < 2 mm limits decrepitation [18]. The interconnected primary pores act as expansion spaces for the calcite crystals and in doing so, limit decrepitation [18]. Sample X’s larger pores (1 – 3.5 mm2) offered more expansion space for the calcite crystals as opposed to sample Y’s pores (0.2 – 2 mm2) and therefore sample Y had a higher level of decrepitation [19]. A fine-grained limestone with a higher amount of micrite (sample Y – 60 %) decrepitates more than a fine-grained limestone with less micrite (sample X – 50 %).
Petrographic results showed that sample Z consists of > 98 % sparry calcite. All the calcite therefore occurs as grains instead of as crystals or mud. The grains are fine to medium-sized. Sparry calcite grains differ from micrite by their larger size, and from carbonate grains by crystal shape and lack of internal texture [20]. Micrites form as a matrix, while sparry calcite forms as a cement [21]. Sample Z also has non-interconnected primary and secondary pores. Of the stone samples tested, sample Z displayed the highest % decrepitation with the following evaluation.
Because the sparry calcite is a cement, the structural integrity of the entire stone disintegrates as the sparry calcite grains move away from one another when shrinking occurs during calcination. There is thus nothing to hold the stone together because the grains are the binding medium of the stone. This is in accordance with the increased disintegration expected for a limestone which is closely interstratified [19]. Sample Z contains stratified sparry calcite. According to the petrography results, sample Z’s pores are in-filled and pores are scarce in the rest of the stone. Thus the expanding sparite crystals have little space to expand and cause the stone to break up, contributing to decrepitation. A limestone consisting primarily of micrite and sparry calcite (sample Z) is expected to decrepitate more than a limestone consisting of large, coarse, mosaic calcite crystals and micrite [19]. A high decrepitation value is expected from a fine- to medium-grained carbonate rock from Zambia [6]. A sparry calcite with graphite inclusions from southern Africa is more prone to decrepitation [6]. Sample Z will therefore experience the most decrepitation during calcination, whereas samples X and Y would experience most decrepitation during heating [19].
3.3 Effect of heat and calcination
conditions of stone samples
In the previous section it was shown that the decrepitation value provides some indication of the structural integrity of carbonaceous rock when exposed to a high temperature environment. In addition to these tests, the stone samples were also assessed in a simulated calcining environment using Thermal Gravimetric analysis (TG). This assessment method provides an indication of how decomposition or calcination occurs, and the decomposition products that result. TG was performed in an inert nitrogen atmosphere (pCO2 = 0 bar) as well as an atmosphere similar to a calcining environment (pCO2 = 1 bar). The two test environments were selected so that any influences (or lack thereof) of the CO2 partial pressure in the calcining environment could be seen clearly.
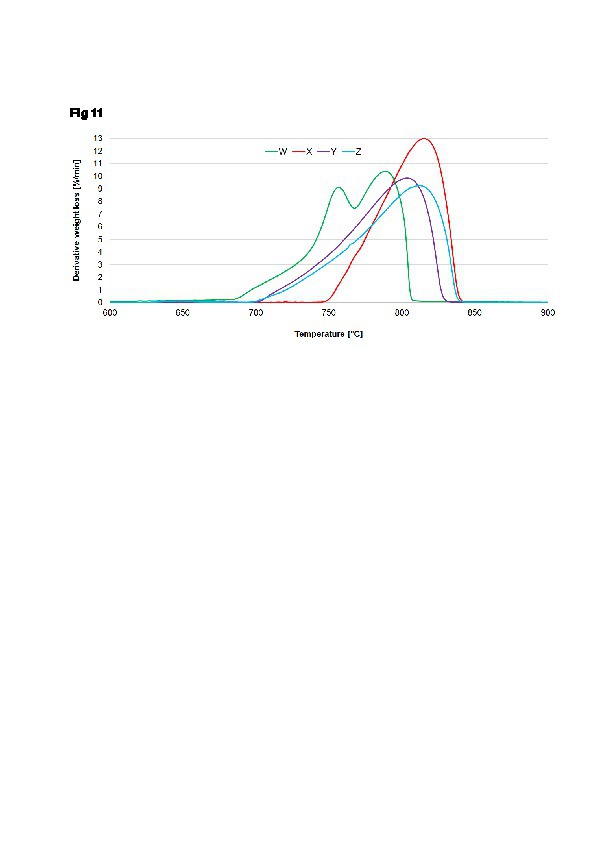
The thermal decomposition results of the stone samples in an inert atmosphere (pCO2 = 0 bar) are presented in Figure 11 as the rate of weight loss versus temperature. It can be seen from the graph that the onset temperature for weight loss of the samples increases in the following order: W<Y<Z<X. The onset temperature for sample W is the lowest and was as expected for a dolomite. Literature suggests that the higher the micrite:sparite ratio, the lower the activation energy in an atmosphere of air [5]. The onset temperatures for samples Y and Z were found to be very similar, even though sample Y has a micritic groundmass and sample Z has no micritic groundmass. This indicates that in a nitrogen atmosphere, the micrite:sparite ratio may not influence the activation energy of decomposition as it does in air where oxygen is present [5].
The higher onset temperature of sample X compared with sample Y may be due to increased activation energy required for decomposition in nitrogen. A higher micrite:sparite ratio results in a lower activation energy [22] indicating a lower onset temperature for sample Y than for sample X. A further possibility is that the raised onset temperature of sample X could be due to a higher amount of impurities compared with sample Y [23]. However, samples Y and Z have different amounts of impurities (in Table 5), but have very similar onset temperatures. This disproves the idea that onset temperature is affected by impurities in this sample. Impurities therefore only affect the available lime obtained from the sample [24].
The dolomite sample (W) shows two distinct peak temperatures between 750 and 800 °C. At these temperatures, the weight loss rate of the sample is at its highest. The peak temperatures for limestones X, Y and Z are very similar and can be attributed to fact that the calcite in each sample decomposes at the same temperature in an inert atmosphere if the mass transfer of CO2 from the sample is not a limiting factor.
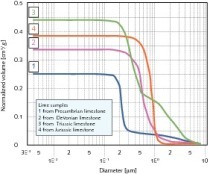
It was hypothesised, in a study of particles up to 90µm in size in a dispersed system, that particle size would influence the rate of limestone decomposition [25]. It was therefore expected that sample Z would decompose faster or at a lower temperature than samples X and Y because it had the smallest d50 value (dZ50 = 114 µm compared to dX50 = 137 µm and dY50 = 178 µm) of the limestones. This is not observed from the experimental results as sample X has the highest rate of decomposition. It can be observed, however, that when the sample is from the same limestone deposit (X and Y), the particle size does have an influence on the decomposition rate once the onset temperature has been reached (decomposition rate of X>Y). It therefore appears as if particle size is not the rate controlling factor for decomposition in an inert atmosphere when the composition and microstructure of stones differ.
The decomposition rate of limestones is known to be dependent on their microstructure [26]. Limestones with larger, more inter-connected pores have higher rates of decomposition [26]. Less compact limestones, like micritic limestones, are also known to create “macrocracks” more easily upon calcination which ease the flow of CO2 out of the stone, thereby increasing the rate of decomposition [26]. From Figure 11, it can be deduced that, in an N2 atmosphere, sample X has the most favourable microstructure for the movement of hot gases through the particles and the escape of CO2 out of the particles. Sample X’s decomposition rate is the highest at pCO2 = 0 bar. The much higher rate of decomposition of sample X in comparison to sample Y is however contrary to [27] specifically regarding the slower decomposition rate of micrite when associated with considerable portions of impurities. Sample X contains more impurities than sample Y and is expected to decompose at a slower rate. Samples Y and Z have larger decomposition ranges because of the slower rate at which they decompose.
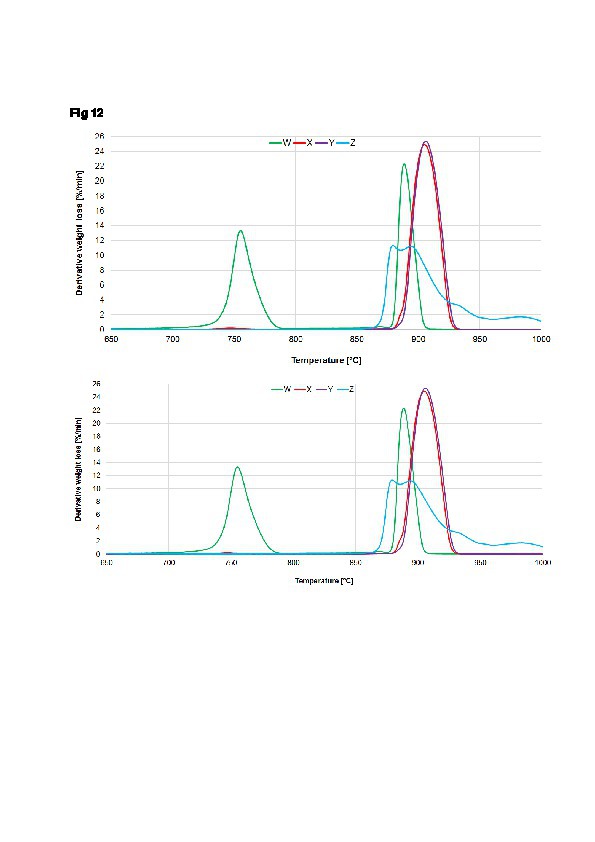
Figure 12 shows the decomposition of stone samples in an environment of pCO2 = 1 bar, which simulates a calcining environment. Sample W displays two clear stages of decomposition in a CO2 atmosphere: MgCO3 decomposition onset at 741 °C and CaCO3 decomposition onset at 880 °C. Samples X and Y both start decomposing at 888 °C, as expected from high purity limestones [24]. Sample Z starts to decompose at a lower temperature, 870 °C. The reason for this early onset is the requirement of lower activation energy for decomposition due to the high amount of sparite in the limestone [5]. Sample X displays a very small peak at 748 °C, coinciding with the magnesite decomposition of sample W, indicating the presence of a dolomite phase.
The observed onset decomposition temperatures of this study are not in accordance with [22] which states that the activation energy of a micritic groundmass stone is less than the activation energy of a sparitic groundmass stone. Thus, the decomposition temperatures of the stones under investigation cannot be explained by their groundmass fabrics. It should be noted that activation energy determines the onset temperature and not the peak temperature.
At pCO2 = 1 bar, calcite is expected to decompose at 890 °C [28] and it can be observed (Figure 12) that sample W has a peak at 888 °C, samples X and Y have a peak at 906 °C, and sample Z has peaks at 880 °C and 894 °C. The differences in the decomposition temperature of CaCO3 in each sample may be attributed to the differences in the microstructure of each sample. Samples W, X and Y have micritic groundmasses while sample Z has a sparitic groundmass (larger crystals than micrite).
Limestone that decomposes at lower tempera-tures yields more reactive lime [29]. From the peak temperatures in Figure 12 it can be deduced that lime from sample Z would be more reactive than from samples X and Y. Knowing that a higher amount of impurities in a limestone yields a less reactive lime [24], it can be said that sample Y would be more reactive than sample X. Thus, the reactivity of the lime produced from these limestones would be expected to increase in the order X < Y < Z.
In terms of the observed decomposition rates of the stone samples, it can be seen that the calcite decomposition in sample W (dolomite) reaches a high rate due to the micritic groundmass [5] and dolomite phase occurring in the stone [26]. Figure 12 shows that the decomposition curves for samples X and Y are similar and are the highest compared to samples W and Z. This result illustrates that both samples X and Y form more and/or larger microcracks/macrocracks in a CO2 atmosphere to allow faster escape of CO2 from the inside to the outside of the particle [26]. It has also been shown in literature that a micritic groundmass favours a faster decomposition rate as opposed to a sparitic groundmass [5], [22], [30]. Some of the microcracks formed in sample X are very possibly due to the dolomite phase occurring in the sample [26], [31].
Sample Z’s decomposition rate decreases because of the quick sintering of the outside of the larger sparite crystals. Sample Z has a limited distribution of pores causing macrocracks to occur only occasionally. They are caused by a heterogeneous distribution of the grain sizes. At 885 °C and 960 °C, “reactivated macrocracks provide pathways for fast CO2 diffusion during calcination.” [26], [32], [33].
4 Conclusion
The research project set out to determine how knowledge about the key physical and chemical properties of limestone for calcination in vertical lime kilns can be utilised in assessing the suitability of a stone source for kiln operation. The assessment was done through a range of physical, analytical and thermal tests on four stone samples of varying composition (limestone and dolomite) from three geographic locations in Southern Africa. The ability to distinguish between the characteristics of the different limestones through single or combined use of analytical methods was successfully demonstrated.
Petrographic analysis, in conjunction with decrepitation tests and Thermogravimetry, proved to be suitable for assessing the structural integrity of limestone upon heating. Chemical analysis data from XRF and XRD analysis, Raman spectroscopy and Single Particle Analysis were used in a complementary way to the thermal analyses and visual analysis (petrography), in deriving explanations for the observed differences in properties exhibited by the samples under investigation. XRF analysis, an industry standard, identified the elements present in each stone sample, while the phase composition was determined subsequently by XRD and Raman spectroscopy. The use of Raman spectroscopy as a complementary procedure to XRD was applied in identifying phases which were not shown up by XRD. Single Particle Analysis was demonstrated to be useful in determining the phases in which Si and Al, common minor constituents of limestones, are present.
The assessment of the microstructure and pore structure of the stone by Petrography is a key aspect in assessing the suitability of a stone for use in a vertical kiln. Petrographic analysis can be utilised in interpreting decrepitation properties and calcination behaviour. Decrepitation tests assess the potential break-up of stone on heating. This important characteristic of the stone can be a deciding factor in the operation of a vertical kiln.
Thermal Gravimetric Analysis provided a comparative assessment method of the onset, peak and offset temperature of every stone under different calcining conditions as well as decomposition behaviour and impurities.
This research highlights the importance of having a combination of chemical, visual (petrography and SEM) and thermal tests for application in limestone assessment. The use of this complete set of criteria offers valuable information on the suitability of a carbonate rock for use in a shaft kiln. These criteria can be applied during the decision-making process in determining whether the stone can be used, as well as during kiln operation to achieve the most efficient kiln performance.
Acknowledgements
The authors record their appreciation for the co-operation and contribution to this research project by Dr. S. Potgieter-Vermaak and staff of the School of Science and the Environment, at Manchester Metropolitan University, in respect of Single Particle Analysis (Dr. M. Toubes Rodrigo), CCSEM (Dr. H. Andrews), and XRD (Dr. G. Miller).
Dr. C. Penn-Clarke of the School of Geosciences at the University of the Witwatersrand is acknowledged for his work on petrographic analysis.