Study of the mechanism of action of metal oxides on the pyrolysis process of RDF
The pyrolysis of RDF under nitrogen conditions was analysed by thermogravimetric infrared (TG-FTIR), while the gas products (CO, NOx and SO2) were investigated during the pyrolysis of RDF with 0.00g, 0.02g, 0.04g, 0.08g of mixed samples of Al2O3, MgO or SiO2 at 900°C using a double tube furnace experimental platform built in the laboratory. The generation pattern of the RDF showed that the RDF was volatilised and cracked in the main thermal pyrolysis stage, while small molecules such as NO and SO2 were generated in the first half of this stage. The release peaks of amphoteric metal oxides (Al2O3) for NOx showed a tendency of decreasing and then increasing with the increase of Al2O3 doping; alkaline metal oxides (MgO) and acidic metal oxides (SiO2) inhibited the generation of NOx; the three metal oxides had obvious effects on the removal of SO2; and the doping of all the three metal oxides could speed up the CO and SO2 generation rates and make the RDF crack. The three metal oxides have obvious effects on the removal of SO2, and the mixing of the three metal oxides can accelerate the rate of CO and SO2 generation, so that the release peaks of CO and SO2 can appear earlier in the RDF pyrolysis process.
1 Introduction
The total annual production of MSW in China has increased from 31.3 million t (1980) to 343 million t (2019) and may reach 480 million t by 2030 [1]. Thus, making RDF from MSW and utilising it will not only be beneficial to the reuse of resources, but will also reduce the pollution of the environment. Nowadays, national and local governments actively encourage the use of cement kiln co-disposal of RDF, which provides a new idea for the efficient disposal of MSW [2]. The combustion of RDF as an alternative fuel in a cement kiln is inevitably influenced by the complex raw meal components. The role of raw material components on the RDF combustion and pyrolysis process is of great significance to investigate the emission mechanism of NOx, SO2 and other pollutants when RDF is used as an alternative fuel.
Some scholars have conducted some studies on the effect of metal oxides on the thermal pyrolysis process of solid fuels. Liu and Gao [3-4] investigated the catalytic effect of metal oxides on coal. Liu used thermogravimetry to examine the pyrolysis behaviour of raw coal and demineralised coal with the addition of inorganic compounds (CaO, K2CO3, and Al2O3); Gao analysed the pyrolysis behaviour of MD (containing a large number of metal oxides such as Fe2O3, CaO, SiO2 and Al2O3 as well as other rare metal oxides) on NO emission from the coal combustion system and the mechanism. Song [5] quantitatively investigated the catalytic effect of alumina trioxide (Al2O3) on the combustion, emission and ash characteristics of biomass above ground (PA) and below ground (PB) in Zingiber officinale by experimental means such as thermo-gravimetric analysis and FTIR. Fang [6 - 7] investigated the catalytic effect of different additives (MgO, Al2O3 and ZnO) on the pyrolysis characteristics and activation energy of municipal domestic waste (MSW) in N2 atmosphere, and the results showed that magnesium oxide (MgO) had a greater positive effect on the residue. Shao, Sun and Liu [8-10] investigated the catalytic effect of metal oxides on the pyrolysis of samples such as sludge, and Shao carried out sewage sludge samples with the addition of different metal oxides in a pyrolysis test; the results showed that metal oxides have obvious catalytic effects on sludge pyrolysis; Sun theoretically and experimentally determined the pyrolysis characteristics of sludge and analysed the general roles of sludge ash, CaO, and Al2O3. Liu used thermogravimetric mass spectrometry (TG-MS) and numerical analysis methods for the pyrolysis of sludge (SS), water hyacinth (WH) and five additives (K2CO3, Na2CO3, MgCO3, MgO and Al2O3) combustion characteristics were quantified and compared.
However, few research reports have been seen on the co-pyrolysis of metal oxides with RDF, while the interrelated roles of gas components such as CO, NOx, and SO2 during the thermal cracking process of RDF are still unclear. In this paper, the pyrolysis behaviour of RDF was investigated by using a TG-FTIR system, and the high-temperature cracking experiments were carried out on RDF mixed with 0.00 g, 0.02 g, 0.04 g, 0.08 g of Al2O3, MgO, or SiO2 by using a double-tube furnace reactor platform in the laboratory to simulate the environment of a decomposition furnace, and the study was carried out to quantitatively and qualitatively characterize the effect of raw material components on the gas components such as CO, NOx, SO2, etc., in the process of RDF pyrolysis, NOx, SO2 and other gases in the RDF pyrolysis process.
2 Experiment
2.1 Experimental materials
The raw materials used in this paper are RDF, Al2O3, MgO and SiO2. RDF is an alternative fuel used by a cement company in Hubei province, which comes from the municipal waste in Wuhan, and the industrial analysis of RDF was carried out in accordance with the national standard (GB/T 212-2008); the elemental analysis of RDF was carried out by using the Vatio EL cube elemental analyser from Elemental Analysis Systems, Germany. The elemental analyses were carried out by using the Vatio EL cube of German Elemental Analysis Systems to determine the elemental content of C, H, O, N and S in the fuel; the calorific value was determined three times by using an oxygen bomb calorimeter, and the average value was taken. Table 1 shows the industrial analysis, elemental analysis and calorific value of the RDF used in the experiments. Al2O3, MgO and SiO2 were produced by Tianjin Zhiyuan Chemical Reagent Co. Ltd, the content of MgO was ≥ 98.0% and the content of SiO2 was ≥ 99.0%.
2.2 Experimental apparatus and methods
2.2.1 TG-FTIR experiment
The gas evolution characteristics during RDF pyrolysis were investigated using an on-line thermogravimetric analyser (TGA, STA-449F3, Netzsch) and a Fourier transform infrared spectrometer (VERTEX-70V). During this experiment, about 5 mg of the sample was placed in an alumina crucible, which was then fed into the furnace of a thermogravimetric analyser (TGA). The internal atmosphere of the TGA was set to be an N2 atmosphere with a flow rate of 20 mL/min, and the sample was heated from room temperature to 1000°C with a heating rate of 20 °C/min.
2.2.2 Pyrolysis experiment of the tube furnace
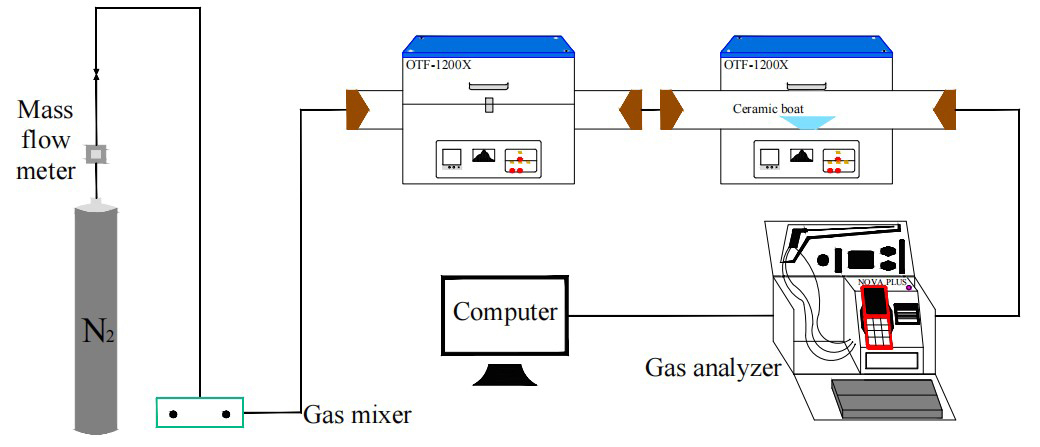
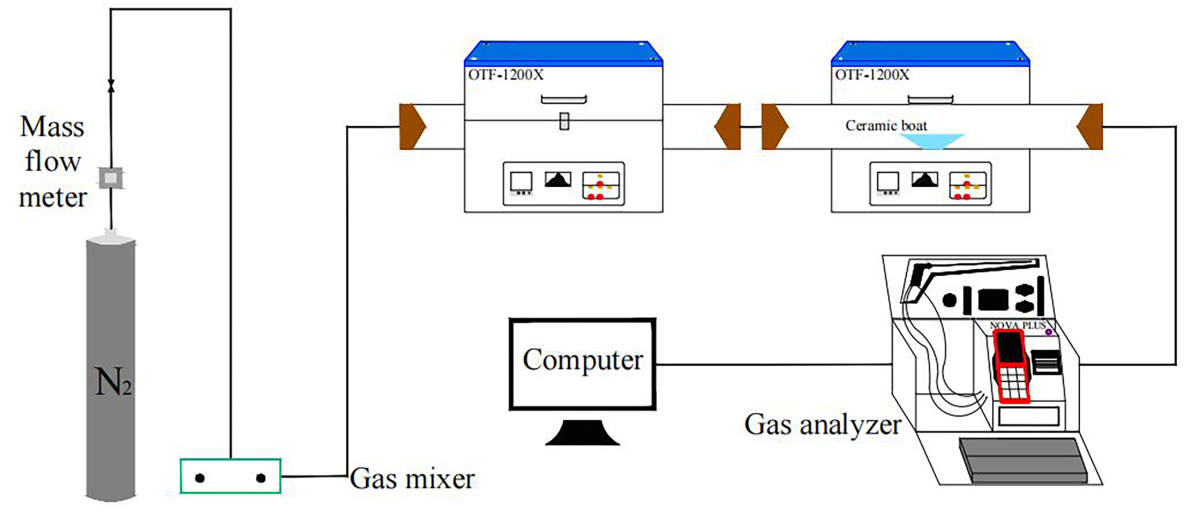
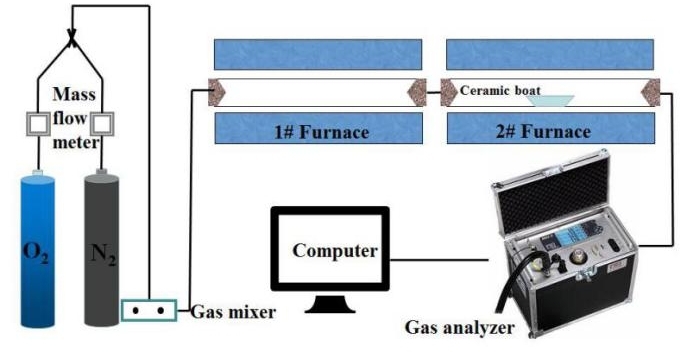
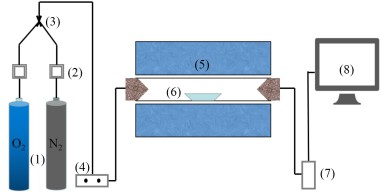
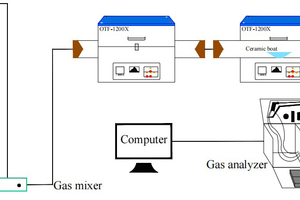
The simulated cracking experimental system is shown in Figure 1, with the tube furnace model OTF-1200X and the adjustable range of furnace temperature: room temperature ~1200 °C. The combustion atmosphere was prepared by N2, and the flue gas analyser (MRU NOVA PLUS) was used to collect on-line data of the flue gas components after combustion of the specimen (recorded every 1 s).
The experimental setup was connected as shown in Figure 1, and the flue gas analyser was turned on and warmed up for 30~40 min. After the flue gas analyser started up normally and entered the monitoring interface, the whole reaction system was ventilated to carry out a cold gas-tightness check. Set the high-temperature tube furnace to heat up to 900 °C at a rate of 10 °C/min and keep warm. Weigh 0.5 g of RDF and different masses of Al2O3, MgO or SiO2, and mix them evenly in a corundum ceramic boat of 60 mm × 30 mm × 15 mm. Open the gas cylinder, adjust the gas distribution cabinet to set the flow rate, set the N2 gas flow rate of 1000 ml/min, and ventilate for 10~20 min. After the gas display on the flue gas analyser is stable, the porcelain boat loaded with samples will be rapidly pushed to the middle position of the high temperature tube furnace, and then continuous measurement will be carried out, until the detection results of CO, NOx and other gases are 0, and the data on the flue gas analyser is restored to the set gas flow density, then stop recording. Each set of experiments was repeated three times and the average value was taken as the final result. CO2 was measured as a percentage, and CO, NOx, and SO2 were measured as mg/L. The average of the results was taken as the final result.
3 Results and Discussion
3.1 TG-FTIR analysis of RDF pyrolysis
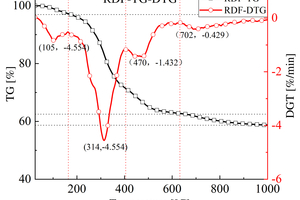
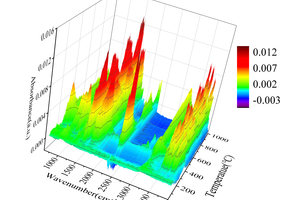
Table 2 shows the FTIR spectral analysis of RDF pyrolysis. Figure 2 shows the thermogravimetric (TG) curve and first-order derivative data curve (DTG) of RDF heated from room temperature to 1000 °C at 20 °C/min under nitrogen atmosphere, and the corresponding three-dimensional FTIR plots are shown in Figure 3.
As shown in Figure 2, the pyrolysis process of RDF can be divided into three independent stages: the preheat cracking stage (3.05% mass loss at 25~164 °C), the main heat cracking stage (34.47% mass loss at 164~632 °C), and the slow decomposition stage of residue (3.81% mass loss at 632~1000 °C) [11]. Firstly, the preheat cracking stage is mainly the loss of free and chemically bound water dehydration and the precipitation of some volatile components, the structure and chemical composition of RDF in this stage are basically unchanged, as can be seen from the 3D FTIR diagram, there is basically no significant absorption peaks in the infrared absorption spectrogram in this stage. Secondly, the main thermal cracking stage is the main stage of thermal cracking of RDF, the structure and chemical composition of RDF begin to change in this stage, and the unstable components in RDF begin to decompose as the temperature continues to rise. This stage can be divided into two parts: the generation of small molecules between 164 °C~405 °C, with a maximum peak at 314 °C in the DTG curve, which can be obtained by combining Figure 3 3D FTIR and Table 2, which is mainly the generation of H2O, CO2, CO, aromatics, alkanes [12], and a small amount of CH4, NO, and SO2 [13, 14]; the generation of large molecules between 405 °C~632 °C, which is the main stage of RDF thermal cracking; and the decomposition of unstable components in RDF with the increasing temperature. ~632 °C is the generation stage of macromolecules, and another peak occurs at 470 °C in the DTG curve, in which a large amount of H2O, aromatics, and alkanes are generated, where small molecules of CO2 begin to decrease, while NO and SO2 basically disappear. Finally, the stage of slow decomposition of residues is mainly the further decomposition of residues that have not yet been thermally cracked completely, and although more energy can be obtained from the RDF with the increase of temperature, the more stable chemical properties of residues make them show a slow decline in the TG curve.
In summary: RDF is volatilised and cracked in the main thermal cracking stage, while small molecules such as NO and SO2 are generated in the first half of this stage, which indicates that not much energy is required to generate these pollutant gases during the cracking process of RDF; since the elemental content of C in RDF reaches 41.94% (Table 1), it still generates a large amount of Aromatics and Alkanes.
3.2 Gases formation rules of RDF pyrolysis at 900 °C
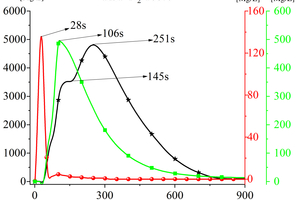
Figure 4 shows the curves of CO, NOx, and SO2 with time during the cracking of RDF at 900 °C. Analysing the generation of gas products when RDF is cracked under nitrogen atmosphere, it can be seen that there are two peaks in the CO release curve with time, which appear at 145 s and 251 s, and the second CO peak is higher and more “sharp and narrow”. According to the carbon combustion mechanism, these two CO peaks correspond to the precipitation peaks of volatile matter and fixed carbon in the fuel, so these two CO peaks can be defined as volatile matter-type CO peaks and fixed carbon-type CO peaks, respectively. The release curve of NOx over time shows the form of a “parabola”, and the earliest time of the peak appears (t=28 s). The release curve of SO2 with time is also in the form of a “parabola”, and its peak time is 106 s. Combined with Figure 3, it can be obtained that, in the cracking of RDF, the N-containing substances are the first to react and reach the peak, and in the late stage of NOx generation, the S-containing substances react quickly to generate SO2 and form the release peak, and the C-containing compounds in RDF also released CO continuously with the reaction, while its peak appeared at the latest time, but its peak was broader.
3.3 Effect of metal oxides on the CO generation pattern of RDF pyrolysis products at 900 °C
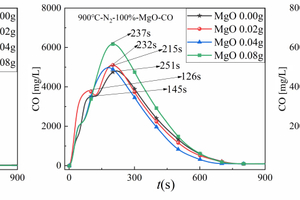
Figures 5(a), 5(b), and 5(c) show the CO release curves with time during cracking of 0.5 g of RDF with different masses of Al2O3, MgO, or SiO2 mixed samples at 900 °C, respectively. Table 3 shows the corresponding peak CO concentrations and formation times.
Figure 5(a) shows the CO generation during the cracking of RDF with different Al2O3 doping, for example, two peaks of CO were formed when RDF was cracked with 0.00 g and 0.02 g of Al2O3 doping, which were the volatile CO peak and the fixed carbon CO peak, whereas there was no obvious volatile CO peak when Al2O3 doping was 0.04 g and 0.08 g. The release peaks of volatile CO show a tendency of decreasing and disappearing with the increase of Al2O3 doping. However, the release peak of fixed carbon CO showed an irregular trend with the increase of Al2O3 doping, and the maximum peak of fixed carbon CO (5404 mg/L) appeared at 0.02 g of Al2O3 doping, and the minimum peak of fixed carbon CO (3900 mg/L) appeared at 0.04 g of Al2O3 doping, which may be due to the fact that Al2O3, as an amphoteric metal oxide, has a broader peak shape than that of fixed carbon CO. result for RDF cleavage [15]. At the same time, the peak time of fixed carbon type CO appeared in the order of 251 s, 226 s, 237 s, and 243 s, which can be seen that the mixing of Al2O3 can enhance the rate of CO cleavage in the RDF, so that the peak of CO appeared earlier, which corresponds to the conclusion that Liu [16] accelerated the decomposition of biowastes by the addition of Al2O3 additives.
Figure 5(b) is used as an example to analyse its CO generation during cracking with different MgO masses doped. The release peak of volatile fractional CO appeared the largest peak when the doping amount of MgO was 0.02g, but the volatile fractional CO peak disappeared with the increase of MgO doping amount. This is due to the fact that a large amount of MgO will absorb SO2 to generate MgSO4 at this time, and this process will compete for the O element in the cracking process, which will lead to the reduction of CO production; the release peak of fixed carbon type CO showed an increasing trend with the increase of MgO mass, and the maximum peak appeared when the admixture amount of MgO was 0.08 g, which may be attributed to the fact that MgO can accelerate the degradation of hydro-carbons [17], which makes it easier for C to combine with O to generate CO, thus leading to a large amount of fixed carbon type CO during the cracking process. Meanwhile, the peaks of fixed carbon type CO appeared in the order of 251 s, 232 s, 215 s, 237s, which shows that the doping of MgO can also enhance the cracking rate of CO in RDF.
Figure 5(c) is taken as an example to analyse its CO generation during cracking with different SiO2 masses doped. The release peak of volatile CO shows a gradual decrease and disappearance with the increase of SiO2 doping. The release peak of fixed carbon type CO showed an irregular trend with the increase of the SiO2 blending amount, and the maximum peak of fixed carbon type CO (5791 mg/L) appeared at the blending amount of 0.02g of SiO2, and the minimum peak of fixed carbon type CO (4155 mg/L) appeared at the blending amount of 0.04 g. This may be due to the fact that SiO2 is an acidic metal oxide for RDF cleavage [15, 18] , and the time for the peak of fixed carbon type CO was 251 s, 226 s, 235 s, 237 s, so the doping of SiO2 can also enhance the rate of CO cleavage in RDF.
In summary, the CO release curves of amphoteric metal oxides Al2O3 and acidic metal oxides SiO2 are similar for the RDF cracking process, and the release peaks of volatile CO show a gradual decrease and eventually disappear with the increase of metal oxides doping, while the release peaks of fixed-carbon CO show an irregular trend with the increase of metal oxides doping, but the maximum peak of fixed-carbon CO occurs at 0.02 g and the minimum peak of fixed-carbon CO occurs at 0.04 g of doping. The maximum peak of fixed carbon type CO appeared at 0.02 g, and the minimum peak of fixed carbon type CO appeared at 0.04 g of mixing amount. However, the release curves of CO from alkaline metal oxides MgO for RDF cracking showed regular changes, the release peak of volatile CO showed the trend of increasing and disappearing with the increase of metal oxides doping, while the release peak of fixed carbon CO showed the trend of gradually increasing with the increase of metal oxides doping. And the addition of all three metal oxides, Al2O3, MgO and SiO2, can enhance the CO cracking rate in RDF and make the CO peak appear earlier.
3.4 Effect of metal oxides on the NOx generation pattern of RDF pyrolysis products at 900 °C
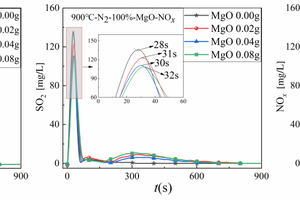
Figures 6(a), 6(b), and 6(c) show the NOx release curves with time when 0.5 g of RDF is cracked with different masses of Al2O3, MgO, or SiO2 mixed samples at 900 °C, respectively, and Table 4 shows the corresponding peak NOx concentrations and formation times.
Figure 6(a) is used as an example to analyse the NOx generation during the cracking of RDF doped with different Al2O3 masses, the NOx release curves with time during the cracking of RDF with different Al2O3 masses are in the form of “narrow” parabola, and the NOx peaks occur earlier at the early stage of RDF cracking, in the order of 28 s, 28 s, 32 s, 31 s, and are basically complete within 100 s after the start of cracking. The NOx release curve at the beginning of RDF cracking is “narrow” and “parabolic”, in the early stage of RDF cracking, the NOx peaks appear earlier, 28 s, 28 s, 32 s, 31 s, and basically completely reacted within 100 s after the start of the cracking, combined with the three-dimensional FTIR diagram in Figure 3, we can see that the RDF at 900 °C can obtain the energy required for the generation of NOx very quickly, and thus it can be quickly reacted. The NOx release peak shows a trend of decreasing and then increasing with the increase of Al2O3 doping, and the minimum release peak of NOx occurs when the doping amount of Al2O3 is 0.02 g, and the maximum release peak of NOx occurs when the doping amount of Al2O3 is 0.08 g, which indicates that a small amount of Al2O3 has a more obvious inhibitory effect on the NOx release, and this is consistent with the study of Song [5], which shows that Al2O3 can inhibit the final NO release, which is consistent with the study of Song [5]. This is consistent with Song‘s [5] study that Al2O3 inhibits the final NO release, but promotes the release of NOx as the content of Al2O3 increases.
Taking Figure 6(b) as an example to analyse the NOx generation during cracking of RDF with different MgO doping, the NOx release curves of RDF cracked with different MgO doping were also in the form of a “narrow” parabola, and the peaks of NOx were earlier. The NOx release peaks show a gradual decrease with the increase of MgO doping, and the minimum NOx release peak occurs at 0.08 g of MgO doping, which indicates that the inhibition effect of MgO on NOx is more obvious, and it can inhibit the emission of polluting gases such as NOx very well.
Figure 6(c) is used as an example to analyse the generation of NOx during cracking of RDF with different SiO2 masses. The release curve of NOx during cracking of RDF with different SiO2 masses is similar to that of MgO, and the release peak of NOx also shows a gradual decrease with the increase of SiO2 mixture, and the minimum release peak of NOx occurs when the SiO2 mixture is 0.08 g. This indicates that the inhibition effect of SiO2 on NOx is also obvious, and it can also inhibit the emission of NOx. The minimum release peak of NOx was observed at 0.08 g of SiO2 blending, which indicates that the inhibitory effect of SiO2 on NOx is also more obvious, and it can also inhibit the emission of NOx, which is a kind of pollutant gas, well.
In summary, the release curves of amphoteric metal oxides (Al2O3) for NOx during RDF cracking showed a tendency of increasing and then decreasing with the increase of the doping amount, whereas the release curves of alkaline metal oxides (MgO) and acidic metal oxides (SiO2) for NOx during RDF cracking showed the same tendency, i.e., both MgO and SiO2 can inhibit the release of NOx very well.
3.5 Effect of metal oxides on the SO2 generation pattern of RDF pyrolysis products at 900 °C
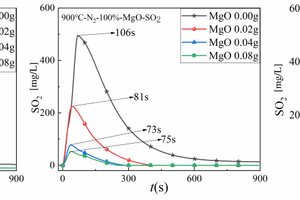
Figures 7(a), 7(b), and 7(c) show the SO2 release curves with time during cracking of 0.5 g of RDF with different masses of Al2O3, MgO, or SiO2 mixed samples at 900 °C, respectively, and Table 5 shows the corresponding peak concentrations of SO2 and the formation times.
Figure 7(a) is used as an example to analyse the generation of SO2 during cracking of RDF with different Al2O3 masses. The release curves of SO2 during cracking of RDF with different Al2O3 masses were in the form of parabola, and the release peaks of SO2 showed a gradual decreasing trend with the increase of the Al2O3 doping amount, namely the maximum SO2 release peak was 496 mg/L at 0.00g of Al2O3 doping, and the minimum SO2 release peak was 25 mg/L at 0.08g of Al2O3 doping, which was due to the fact that Al2O3, as a kind of metal oxide, would act as an absorber, thus reducing the release of SO2; meanwhile, the time of SO2 peaks were as follows 106 s, 75 s, 76 s, and 72 s, which indicates that with the doping of Al2O3 will promote the rate of SO2 generation during the RDF cracking process, thus accelerating the cracking speed of RDF. Figures 7(b) and 7(c) show the SO2 generation during cracking with different MgO and SiO2 masses, and the SO2 release curves with the generation of MgO and SiO2 are similar to that of Al2O3, and meanwhile, from Table 5, it can be seen that SiO2 has the best removal effect for SO2.
To sum up: the three metal oxides have obvious effects on SO2 removal, and the doping of metal oxides can accelerate the SO2 generation rate.
4 Results and conclusions
1. The CO release curves of amphoteric metal oxide Al2O3 and acidic metal oxide SiO2 are similar for the RDF cracking process, the release peak of volatile CO shows a gradual decrease and eventually disappears with the increase of the mixing amount of Al2O3 or SiO2, while the release peak of fixed-carbon CO shows an irregular trend with the increase of the mixing amount of Al2O3 or SiO2, but the maximum peak of fixed-carbon CO appears at 0.02g of mixing amount. However, the maximum peak of fixed-carbon CO appeared at 0.02 g and the minimum peak of fixed-carbon CO appeared at 0.04 g of mixing amount. However, the release curves of CO from alkaline metal oxides MgO for the RDF cracking process showed regular changes, the release peak of volatile CO showed the trend of increasing and disappearing with the increase of MgO doping, while the release peak of fixed carbon CO showed the trend of gradually increasing with the increase of MgO doping. Moreover, the doping of Al2O3, MgO or SiO2 metal oxides can enhance the CO cleavage rate in RDF, so that the CO release peak appears earlier.
2. The release curves of amphoteric metal oxides (Al2O3) for NOx in the RDF cracking process showed a tendency of increasing and then decreasing with the increase of the doping amount, while the release curves of alkaline metal oxides (MgO) and acidic metal oxides (SiO2) for NOx in the RDF cracking process showed the same tendency, i.e., both MgO and SiO2 can inhibit the release of NOx very well.
3. All three metal oxides have obvious effects on SO2 removal, and the doping of all three metal oxides can accelerate the SO2 generation rate, so that the SO2 release peak appears earlier in the RDF cracking process.
Acknowledgements
This work was financially supported by the scientific research plan guiding project of education department of Hubei province, China (B2021011) and 2022 innovation and entrepreneurship training program for university students of of Hubei province (S202210488088).