Cement and clinker imports: embodied carbon, carbon costs, and the EU Carbon Border Adjustment Mechanism (CBAM)
When the European Union (EU) Carbon Border Adjustment Mechanism (CBAM) comes into force, importers of Portland cement and clinker will be required to purchase carbon allowances for their goods. Herein, the trade flows into the EU are mapped by country and the equivalent carbon dioxide (CO2-eq) emissions from production is modeled. Using average allowance prices, the additional cost passed to the consumer if carbon allowances had been purchased for imports in the modeled years are estimated. Together, this retrospective analysis provides insights into CBAM and the potential implications of carbon allowances on the cost of imported goods.
1 Introduction
There is urgent need to reduce global greenhouse gas (GHG) emissions to mitigate the worst effects of climate change [1]. To encourage progress towards more efficient, lower emitting industry, governments have implemented carbon allocation and emissions trading schemes (e.g., so-called cap and trade, carbon taxes, and emission trading programs) [2, 3]. In the European Union (EU), emitters in regulated industries must purchase carbon emission allowances on the Emissions Trading System (ETS) market to match annual emissions. To maintain EU production competitiveness, the EU ETS provides some industries with free allocations of carbon allowances [4]. However, these free allocations are being reduced with the goal of phasing them out [5]. To mitigate emissions leakage, where production is shifted geographically to avoid carbon reduction measures, the EU has introduced the Carbon Border Adjustment Mechanism (CBAM) which has been in a transitional period since 2023 [3, 6]. In 2026, CBAM will take full effect and require importers of iron and steel, aluminum, cement, fertilizers, hydrogen, and electricity to purchase and surrender carbon allowances for the product’s embodied CO2 [6].
During the CBAM transitional phase, importers onyls need to report the embodied CO2. With the end of this transition phase in 2025 and the start of allowance purchase mandates in 2026, this work provides a retrospective analysis of clinker and cement imports into the EU from 2021-2023 by mapping imports of clinker and cement into EU member states, comparing the embodied CO2 impacts from production of clinkers, and estimating the potential costs of allocation purchases.
2 Background: greenhouse gas emissions
and the cost of carbon
The building and construction industry is a significant source of GHG emissions with concrete and cement accounting for roughly 8% of global CO2 emissions [7]. These emissions come primarily from the production of clinker which releases CO2 during the decomposition of carbonates into oxides during kilning. This kilning also requires large amounts of thermal energy which also significantly contribute to the GHG emissions of clinker production [7, 8]. Despite accounting for only ~10% of the mass of concrete, Portland cement contributes the majority of the GHG emissions associated with the production of concrete [7].
By driving to climate change, GHG emissions cause real-world damage which has an economic cost [9]. For Portland cement and other high-embodied carbon building materials, these costs are not fully accounted for in the price of the product and instead are borne by society at large [9, 10]. Estimates for the social cost of carbon have varied greatly [11], with the United States (US) Environmental Protection Agency (EPA) estimating emissions costs in 2022 at $ 120 to 340/tonne CO2 for discount rates from 2.5-1.5% [12]. Emissions trading markets present a mechanism by which the economic cost of GHG emissions can be partially incorporated into the price of the product and, thus, more of the cost associated with the embodied CO2 emissions are borne by the material consumer [2]. In 2023, 73 emissions trading or carbon taxes were in effect globally and schemes are scheduled for implementation or implemented on every inhabited continent with the EU having some of the highest allowance prices in effect [3].
3 Results and Discussion
3.1 Cement imports and embodied carbon
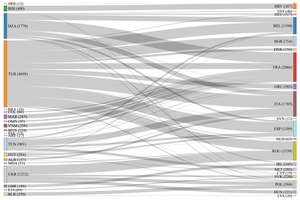
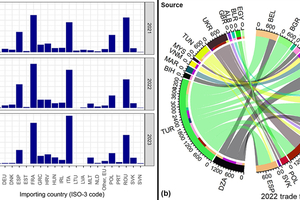
Using reported import data of Portland cement and cement clinker, the production region of each material flow into an EU member country was identified. Calcined clays and aluminous cements also covered by CBAM were excluded from this analysis (see Overview of Methods and Data). An approximate equivalent clinker mass was calculated assuming a clinker content of 0.8 in the cement. Figure 1a shows the equivalent clinker import mass by importing country and Figure 1b shows the trade flows from external countries into the EU in the year 2022. France (FRA), Italy (ITA), and Romania (ROU) imported the largest amount of clinker and Portland cement in the years studied. In 2022, Türkiye (TUR) was the largest source of the studied materials and supplied 100% of imports to Denmark (DNK), 97% to Bulgaria (BGR), 81% to Greece (GRC), 65% to Spain, 58% to Belgium (BEL), 49% to Italy and 47% to Romania. After Türkiye, Ukraine (UKR) and Algeria (DZA) were the next largest exporters to the EU, with Ukraine comprising 48% of imports to Romania and Algeria supplying 35% of non-EU imports to France.
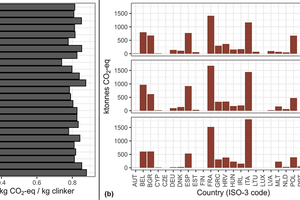
From the production regions, the environmental impacts were estimated using the regionally representative electricity grid and thermal energy mixes. Importantly, only clinker production impacts were considered, and the other 20% of the cement mass was not modeled. This underestimates the total CO2 emissions from cement production, especially for manufactured SCMs (e.g., calcined clays). Figure 2 shows the average environmental impacts of imported clinker per unit mass by EU importer in 2022 (Figure 2a) and the annual CO2-eq for the imported materials by importing EU country (Figure 2b). Notably, the emissions from biomass combustion are included and, thus, mirror the EU Joint Research Centre report [19] used to calculate the default CO2 emissions values. The kg CO2-eq per unit mass varies from 0.71 to 0.88 kg CO2-eq/kg clinker depending on the production country (the CBAM uses a default value of 0.87 kg CO2-eq/kg clinker during the transition phase [13]). Varying estimated CO2-eq emissions are due to different regional energy mixes for thermal fuels and electricity as well as different kiln efficiencies affecting the energy demand for producing clinker. This shifting source affected the average CO2-eq of the imported goods. For example, the 2022 average impact for Estonia (EST) is 0.73 kg CO2-eq/kg clinker which reflects the relatively low production emissions from Algeria, Estonia’s source of imports that year. Meanwhile, 2022 imports to France are approximately half from Algeria, but have notable fractions coming from Morrocco (MAR) and Türkiye. These countries have higher estimated CO2-eq per unit mass than Algeria and lead to higher average embodied emissions (0.79 kg CO2-eq/kg clinker in 2022). While the embodied emissions did vary on a mass basis depending on the source, the annual emissions largely mirror the import masses (Figure 1b). This highlights that consumption volume is the driving factor behind the annual CO2-eq emissions of the imported materials.
3.2 Prospective costs of carbon allowances
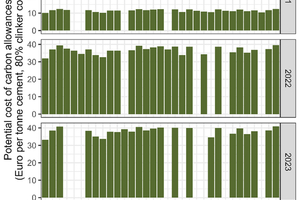
To illustrate potential cost implications of mandated carbon allowance purchases, the annual CO2-eq emissions for the imported materials were scaled with the annual average price per tonne of CO2 allowance purchased (in Euros). The reported average cost per tonne CO2 allowance were € 25.20, € 80.18, and € 83.00 in 2021, 2022, and 2023, respectively [14, 15, 16]. Notably, these allowance prices are much smaller than the US EPA calculated social cost of carbon in 2020 (~ € 105 to 297 in 2020 per tonne CO2, depending on discount rate) [12]. As shown in Figure 3, escalating allowance prices can have a large impact on the additional cost of the imported material.
If allowances were to be purchased at the 2022 or 2023 price and that cost transferred to the consumer, we estimated imported Portland cement costs would have increased by approximately € 32 to 38 in 2022 per tonne Portland cement and € 39 to 41 in 2023 (assuming a clinker content of 80% and a free allowance allocation of 30%). At the 2021 level, we estimate aditional costs would have been approximately € 10 to 12 per tonne cement. Importantly these estimates do not consider market factors from changing demand for carbon allowances (i.e., demand changes from the CBAM requirements or the reduction in freely allocated allowances to EU producers). If demand for allowances were to increase for the same or fewer carbon allowances, prices could increase. Further, free allowances have an annual reduction schedule, which would increase the allowances needed to be purchased for a fix emission volume [5]. Conversely, if the importer product is already covered by a system like the EU ETS, these already purchased allowances could be deducted and the additional cost would decrease. We estimate average costs of ~ € 60-80/tonne cement for 2021-2023 (cost, insurance, and freight price for EU countries reporting import value in Euros). Notably, adding the price of carbon allowance in these years would have represented a large increase in the cost of imports.
4 Summary
In this work, recent trade statistics are used to estimate the embodied CO2-eq emissions for Portland cement, clinker, and other hydraulic cements imported into the EU from non-EU countries. Considering transitioning carbon border adjustment mechanism enforcement, we model the average CO2-eq per kg clinker in 2021, 2022, and 2023 imported by EU country. Using the average European Union Emissions Trade System carbon allowance prices from the same years, we estimate the average additional cost per tonne cement if allowances had been purchased at the average price. In all, per unit mass emissions varied depending on the country of origin (0.71 - 0.88 kg CO2-eq/kg clinker). However, the annual embodied emission from the imported materials was driven by the mass of material imported. If allowance had been purchased, the cost was estimated to be € 10-12 in 2021 per tonne cement, € 32-38 in 2022 per tonne and € 39-41 in 2023 per tonne. We note that this estimate could vary greatly from actual prices in the future depending on the free allocation of allowances, the demand and supply of carbon allowances on the market, and a shifting emission regulation landscape. These additional costs from allowance purchases are large when compared to the estimated cost of the imported cement between 2021-2022.
5 Overview of methods and data
To understand the embodied carbon in imported cementitious binders and the potential implications of CBAM on the cost of imported materials. The emissions from imported material into the EU were modeled for 2021, 2022, and 2023. These estimates were coupled with the average carbon allowance costs to illustrate potential cost implications of carbon allowance purchases. Model assumptions as data are summarized in Table 1.
To estimate the production impacts of clinker and cement imports from 2021, 2022, and 2023 the CO2-eq from energy requirements for clinker production and the CO2 from the decomposition of carbonate materials was modeled. A global CO2 release from decomposition was modeled as 0.485 kg CO2/kg clinker [8] and electricity grid mixes were modeled based on the regional electricity mixes from the International Energy Agency (IEA) World Energy Balance (WEB) [17]. The thermal fuel mix was modeled as the regional thermal fuel use for non-metallic mineral manufacturing in the IEA WEB. The thermal and electric energy demands were modeled based on regional averages from the Getting the Numbers Right Project (GNR2.0) data reported by the Global Cement and Concrete Association (GCCA) [18]. For both IEA and GCCA data, data representing 2022 was used. While carbon impacts from biomass combustion are often not included, herein the contribution of biomass combustion is considered, aligning with the methodologies used in the OpenConcrete Tool [8] and in an EU Joint Research Centre report [19]. Where country-level exporters were not provided or country level estimates were not possible, the world average production emissions were used. Impacts from transportation are not included in the production emissions used to model costs.
Annual imports of Portland cement (CN 2523 29 00 and CN 2523 21 00), other hydraulic cement (CN 2523 90 00) and cement clinker (CN 2523 10 00) was extracted from the United Nation (UN) Comtrade database [20]. Other hydraulic cements and white cements make up approximately 10% of total import mass. To simplify modeling, these are estimated as having the same clinker content as ordinary Portland cement and clinker production process as ordinary cement clinker. This likely overestimates the impacts from other hydraulic cements and underestimates the impacts from white Portland cement [13]. Note, CBAM cement regulations also apply to calcined clays (CN 2507 00 80) and aluminous cements (CN 2523 30 00). However, the imports of calcined clays and aluminous cements are not considered here and the environmental impacts from these products are not modeled [13]. Countries with annual product import flows lower than 50 tonnes are also excluded from this analysis as these flows fall below the CBAM reporting threshold [21]. Average carbon allowance costs are collected from reports by EU Environmental Agency and the European Commission. The values were used as reported and, thus, the Euro amounts represent Euro in the given year (Euros amounts are not discounted or adjusted). Notably, increasing demand for carbon credits (from both domestic producers and importers) may affect market prices. These impacts are likely to be concomitant with other regulatory changes to the carbon pricing system. Neither supply and demands changes nor changing regulations were considered here.
no. 2, pp. 243–259, Feb. 2024, doi: 10.1080/14693062.2023.2200758.
production,” Environ. Res. Infrastruct. Sustain., vol. 2, no. 4, p. 041001, Dec. 2022, doi: 10.1088/2634-4505/ac8a6d.
report_final.pdf
Brussels, Dec. 2023.
in 2022 pursuant to Articles 10(5) and 21(2) of Directive 2003/87/EC,” European Union, Brussels, COM(2023) 654 final, Oct. 2023. Accessed: Mar. 10, 2025. [Online]. Available: https://eur-lex.europa.eu/legal-content/EN/TXT/?uri=celex:52023DC0654
Accessed: Mar. 11, 2025. [Online]. Available: https://data.europa.eu/doi/10.2760/359533