

Effects of different activators on the mechanical properties, hydration kinetics, and pore structure of phosphogypsum foam concrete
As a by-product of phosphoric acid synthesis, phosphogypsum (PG) is generated at a rate of 4–5 t per ton of phosphoric acid produced [1]. The chemical process is illustrated by Equation (1):
China is one of the world’s largest PG producers, with an annual output exceeding 75 million tons, but its comprehensive utilization rate is merely 44% [2]. Figure 1a shows the enormous stockpiling volume of PG at stockpile of Anhui Sierte Fertilizer Co., Ltd., which is representative of the extensive stockpiling issue in China. It can be observed from Figure 1b that PG is a relatively compacted piled powder, its long-term open-air storage can lead to the leaching of harmful substances (e.g., soluble phosphorus, fluorine), which contaminate surrounding soil, groundwater, and vegetation, thereby posing potential risks to ecological environment and human health [3, 4]. Therefore, PG utilization has become a critical and urgent issue. Despite its widespread use in industries such as chemical manufacturing [5], agriculture [6] and construction [7, 8], the utilization rates remain low. In agriculture, PG is restricted by harmful impurities that threaten soil and food safety, while in the chemical industry, its complex composition and high treatment cost render it economically unattractive. Building materials are one of the most effective methods for PG recycling and have been extensively studied by researchers, primarily focusing on the preparation of cement retarders, masonry or board products and roadbed construction. However, in masonry or board products where PG replaces natural gypsum, the cost increases caused by impurity removal led to no obvious price advantage, and its color is also unacceptable to the market. For the co-production of sulphoaluminate cement (SAC) using PG, the production process is complicated, and the resulting cement and sulfuric acid products are priced similarly to existing market products, resulting in a lack of competitiveness.
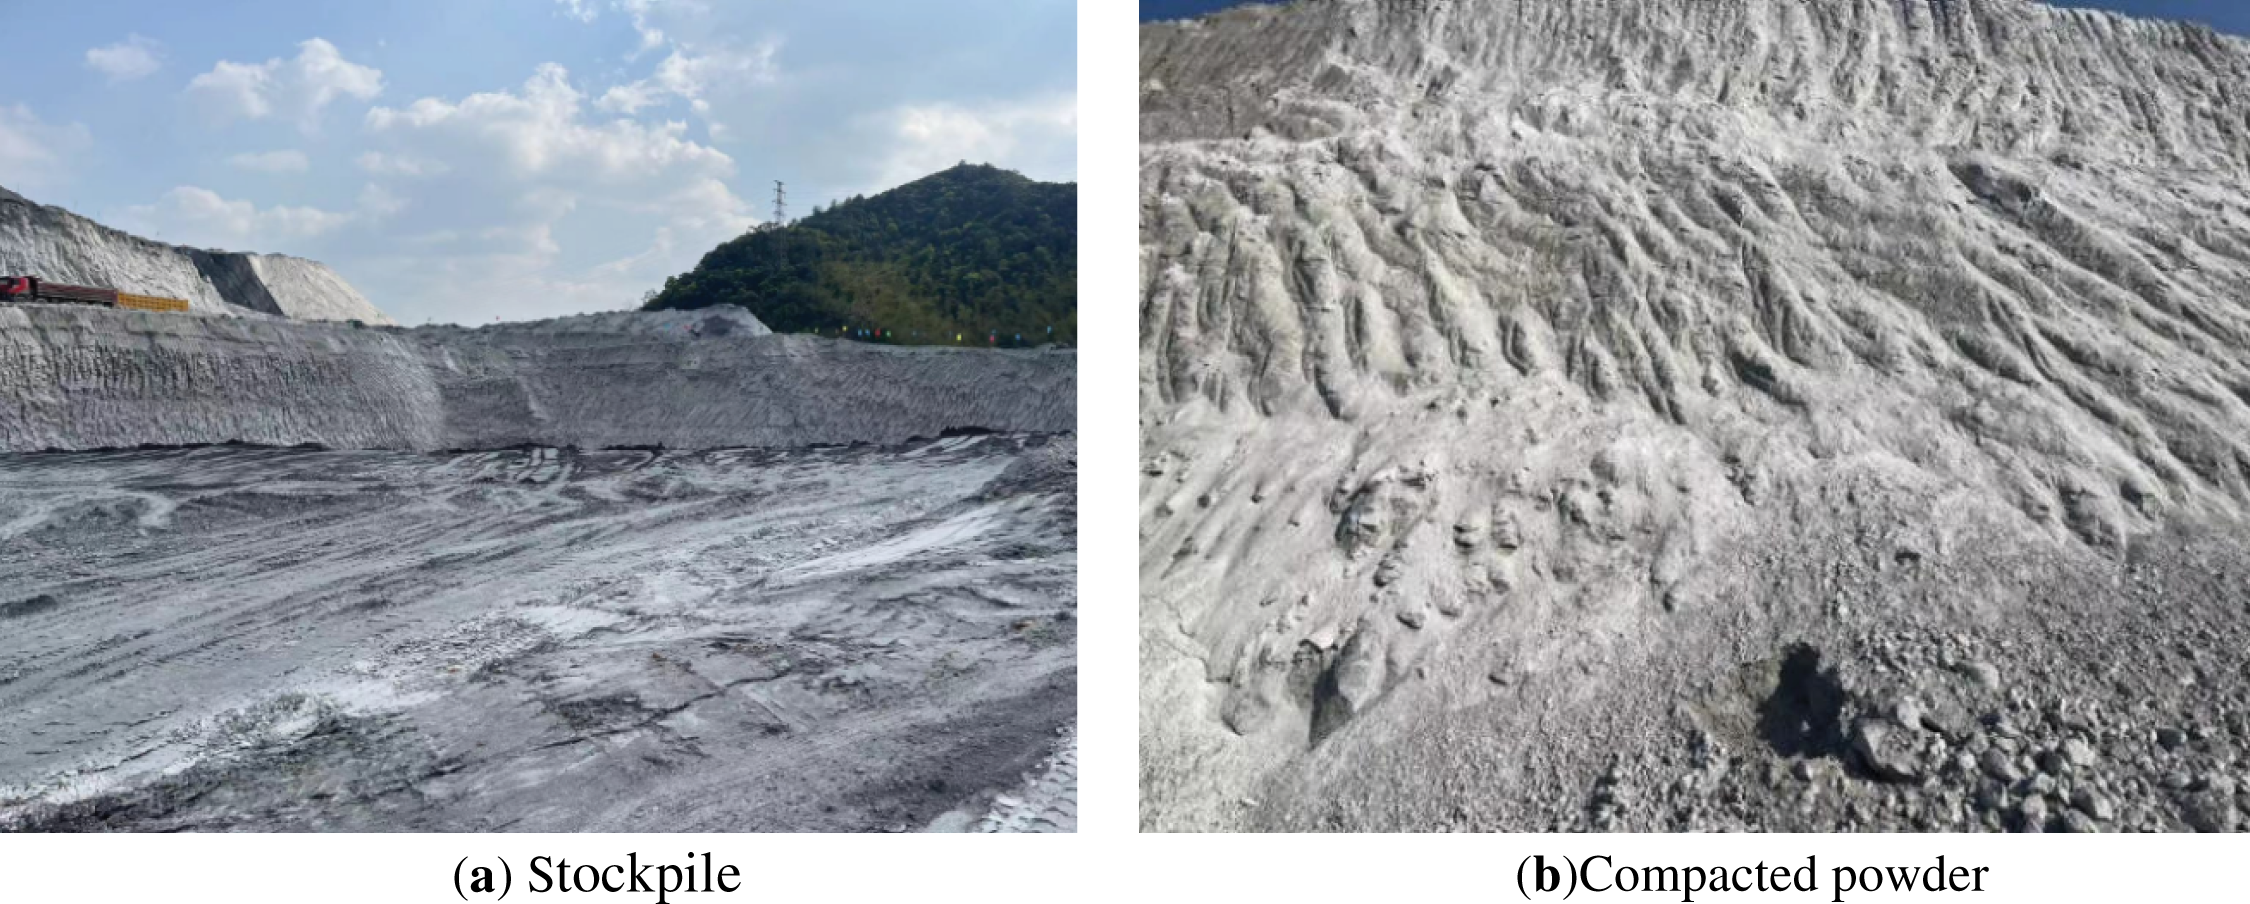
Figure 1 Phosphogypsum stockpile site in Sierte Fertilizer Co., Ltd., Anhui Province, China
Foam concrete was adopted as a roadbed material due to its advantages in reducing differential settlement, minimizing land occupation and lowering construction difficulty. However, its production involves high carbon emissions when use cement as main raw material. Replacing some of the cement with PG not only facilitates the utilization of solid waste, but also aligns with green development principles. Tian et al. [9] determined that the optimal PG content is between 45% and 55%, achieved by adjusting the ratio of untreated PG to small amounts of cement, slag powder and quicklime. Most PG acts as a filler, while a small amount promotes hydration as sulphate to form calcium aluminate hydrate, enhancing strength. Kuang et al. [10] developed PG foam concrete with a high fly ash (FA) content and an optimal cement replacement of 15%. This achieved a compressive strength of 3.36 MPa, meeting the current requirements for subgrade material strength and demonstrating the feasibility of lightweight PG foam concrete with a high FA content. Xu et al. [11] optimized the mix proportions of two types of PG-based foam light soil (viz. PC-OPC-microsilica foam light soil and PG-OPC-GGBFS foam light soil) via single-factor experiments. When the PG content was set at 60%, PG-OPC-GGBFS was found to outperform PC-OPC-microsilica with more excellent mechanical properties and thermal conductivity, verifying the feasibility of high-volume PG application in foam light soil for geotechnical engineering.
PG contains phosphorus and exhibits retarding properties. Many researchers have activated PG systems using various alkali activators, including WG [12], sodium hydroxide [13], lime [14, 15], sodium aluminate (SA) [16], and calcined PG [17]. The reaction mechanism involves three stages-dissolution, hydrolysis and condensation-which effectively shorten setting time, reduce flowability and enhance strength and water resistance [18]. As the most commonly used activator, WG provides an alkaline environment and enhances pozzolanic reactions through active silicates, promoting the degree of hydration [19]. Luo et al. [20] employed WG to activate FA-lead-zinc smelter slag-based alkali-activated material (AAM), observing that the compressive strength of AAM increased within a certain range with rising alkali content and modulus. Yin et al. [21] utilized WG to activate an AAM with coal gangue-GGBFS-waste ceramic powder as precursors, finding that the strength peaked at 94.1 MPa with a 5% WG dosage. Guo et al. [22] activated a GGBS-FA-steel slag system and observed that WG promoted gel formation, improved matrix porosity and enhanced microstructural density. However, WG can also have negative effects, such as increasing drying shrinkage [23]. SA is also commonly used as a setting accelerator in grouting materials for leak sealing and structural reinforcement in engineering structures. Compared to WG, it is more soluble, dissolving in water to form Na+ and Al(OH)4− ions [24, 25]. Liu et al. [26] found that SA promotes preferential gel formation in slag, thereby enhancing the mechanical properties of the matrix. Furthermore, its activation effect on germanium slag is more effective than that of sodium carbonate and calcium hydroxide [27]. After high-temperature calcination, PG loses significant organic matter. The soluble phosphorus and sodium react with calcium sulphate at high temperatures to form calcium pyrophosphate and sodium sulphate, which adhere to the surface of gypsum crystals. This creates crystal defects that accelerate the hydration process. Cao et al. [28] found that, compared to natural gypsum and desulfurization gypsum, anhydrous gypsum exhibits superior late-stage mechanical properties, with a higher softening coefficient and greater overall stability than hemihydrate gypsum. Calcined PG exhibits superior mechanical properties and water resistance with consistent quality, compensating for the performance instability of hemihydrate gypsum [29].
Research into the effects of different activators on the properties of PG foam concrete and the underlying mechanisms is limited. There is an insufficient understanding of the relationships between pore structure, hydration and performance. PG has a retarding effect, and activators can strengthen the PG foam concrete matrix and prevent formwork collapse caused by excessively prolonged setting times. However, overly strong activation effects can lead to the cementitious paste becoming dry and viscous or causing powder agglomeration. This study aims to investigate the effects of different activators on the properties of PG foam concrete. Three activators-water glass (WG), sodium aluminate (SA) and calcined phosphogypsum (CPG)-were employed, with PG replacing 60% of the cement content. The study examines the impact of these activators on the flowability, mechanical properties, and heat of hydration of PFC. The pore structure was evaluated using low-field nuclear magnetic resonance (LF-NMR).
2 Raw materials and test methods
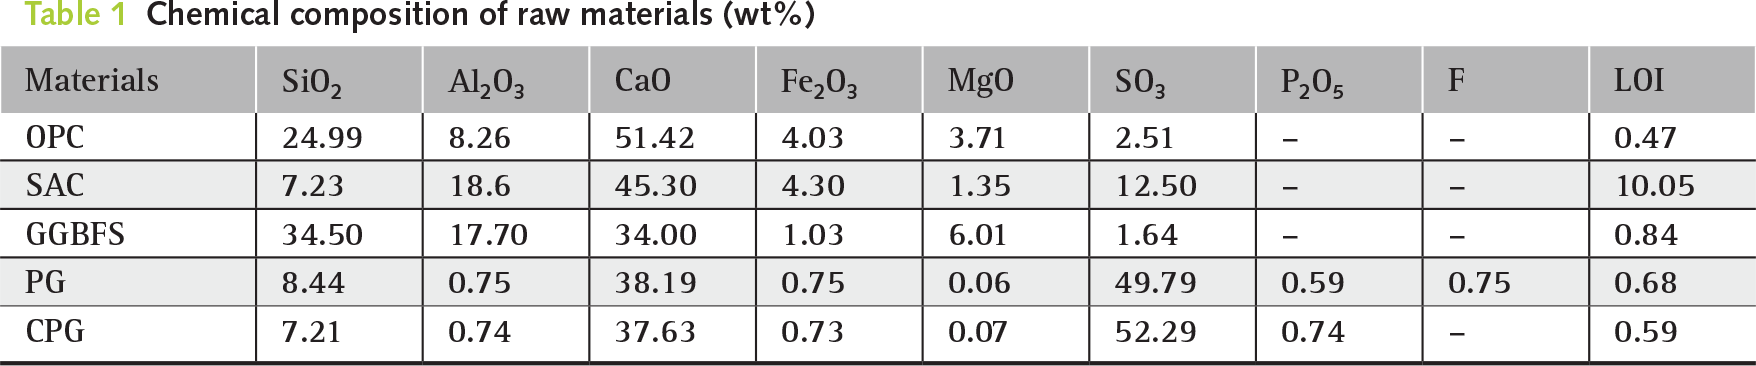
Ordinary Portland cement (OPC 42.5) and SAC were manufactured by Zhucheng Jiuji Building Materials Co., Ltd., China. The ground granulated blast furnace slag (GGBFS) was grade S95 with a moisture content of 0.8%, produced by Gongyi Longze Water Purification Materials Co., Ltd., China. Raw phosphogypsum was obtained from the stockpile of Anhui Sierte Fertilizer Co., Ltd., China, and subjected to laboratory pretreatment involving crushing and sieving through a 50-mesh (0.3 mm) screen. This material had a bulk density of 2.09 g/cm3 and a natural moisture content of 18%. The calcined phosphogypsum (CPG) was calcined at 480°C for two hours and then held at this temperature for a further two hours. CPG was used because anhydrite can contribute to strength development, and its setting and hardening process can be synchronized with other cementitious materials. Hence, replacing part of the PG with CPG can improve the early-age strength of PFC. The calcination temperature of 480°C was selected because our TG analysis showed that Type II anhydrite is formed between 420°C and 500°C, and the anhydrite in CPG exhibits the highest hydration reactivity at 480°C. The chemical compositions of the raw materials are listed in Table 1. Krichen et al. [30] indicated that the impurities in PG have a significant negative effect on the strength of prepared materials. With the increase of impurity contents, the compressive strength and structural integrity of PG-based products decrease obviously. The CaO/SO3 mass ratio is an indicator to evaluate the purity of PG. The theoretical CaO/SO3 ratio of pure gypsum is about 0.7. A higher CaO/SO3 ratio indicates the introduction of extra acidic components such as soluble phosphate, sulfate, and residual acidic substances. The CaO/SO3 ratio of PG in this work is 0.767, which falls within the range of 0.672~0.937 reported in literatures [31–33], indicating that the PG used is a representative type.
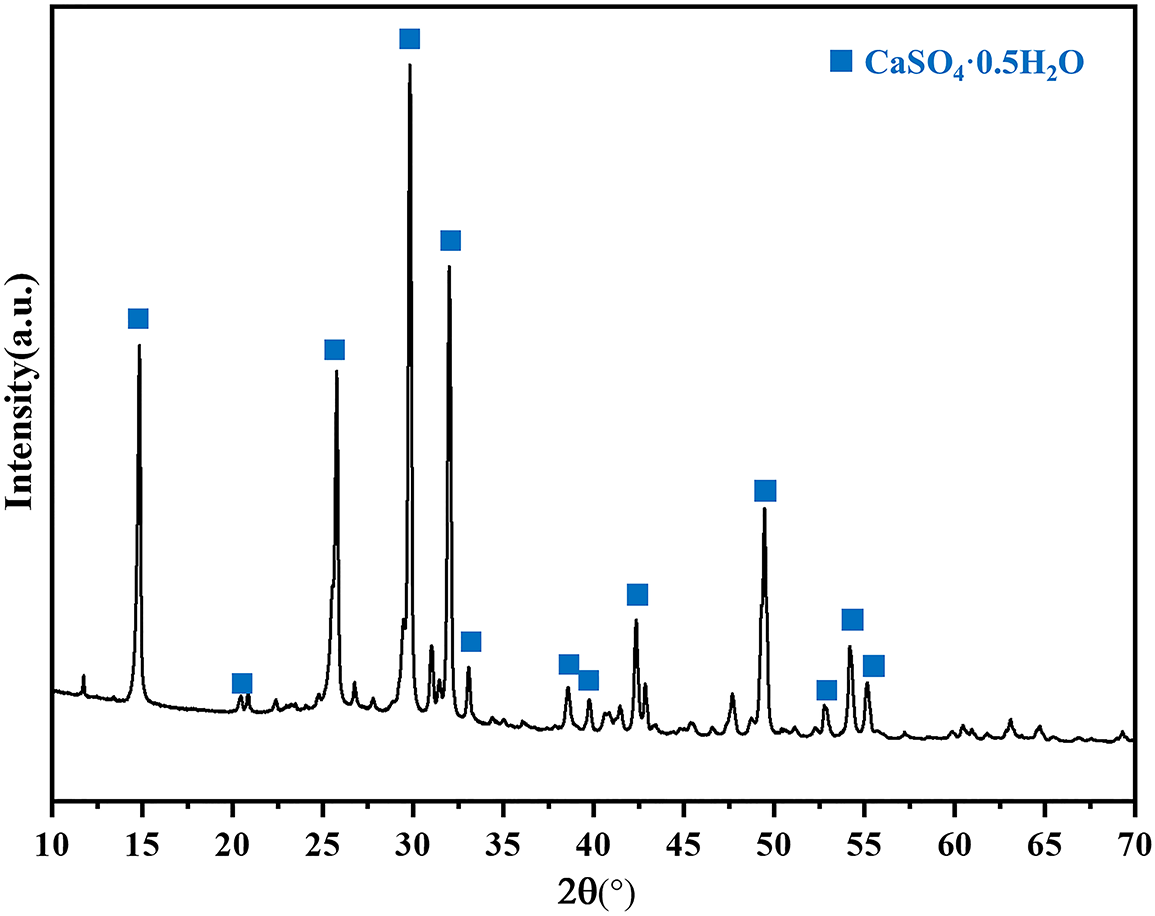
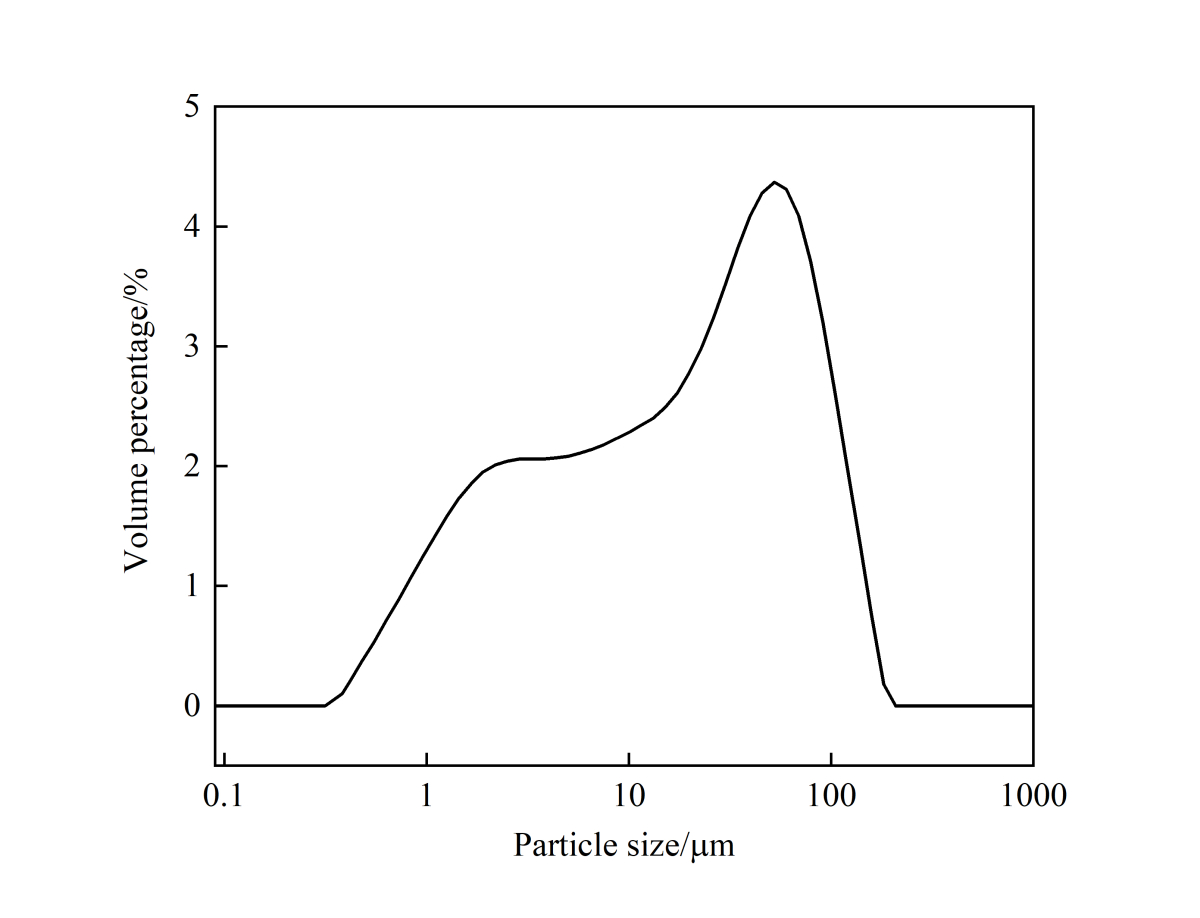
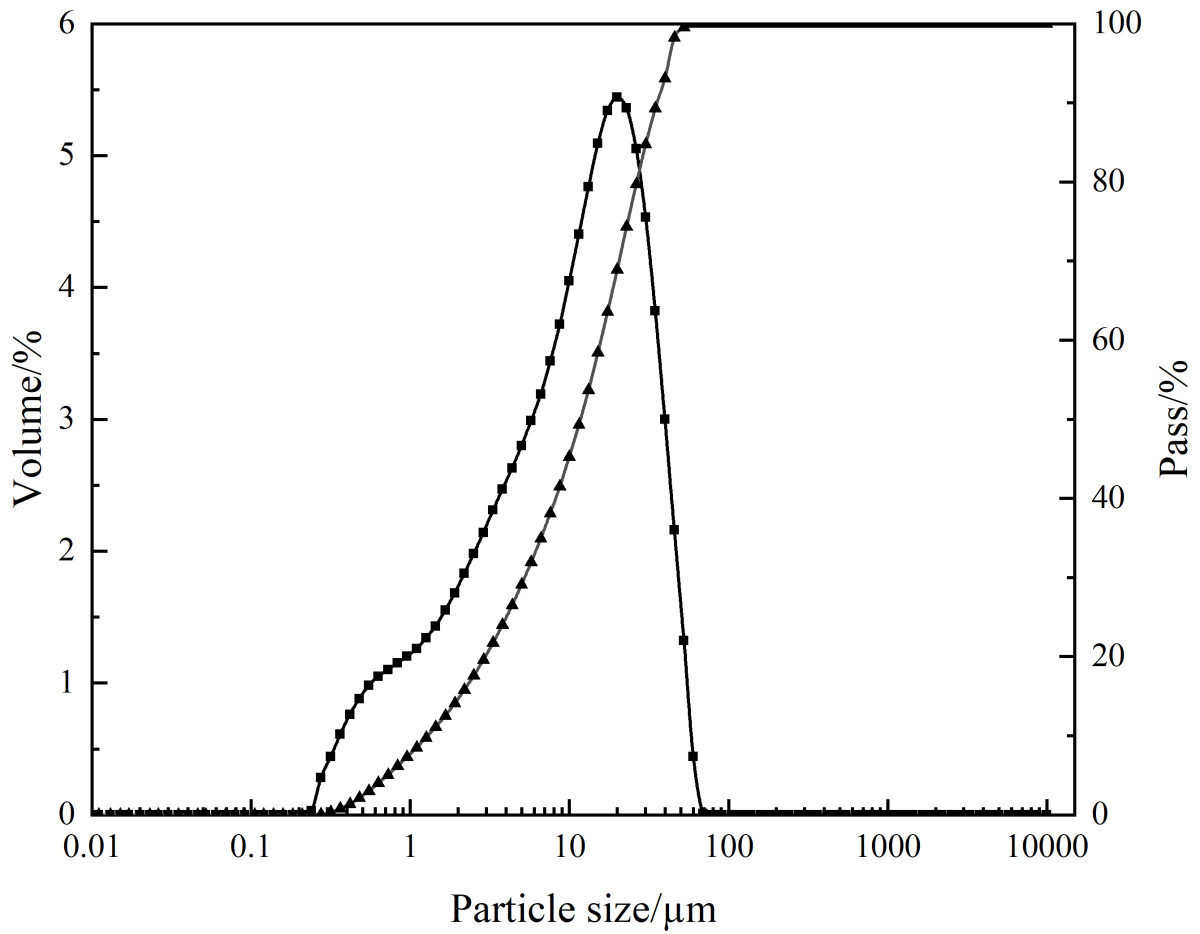
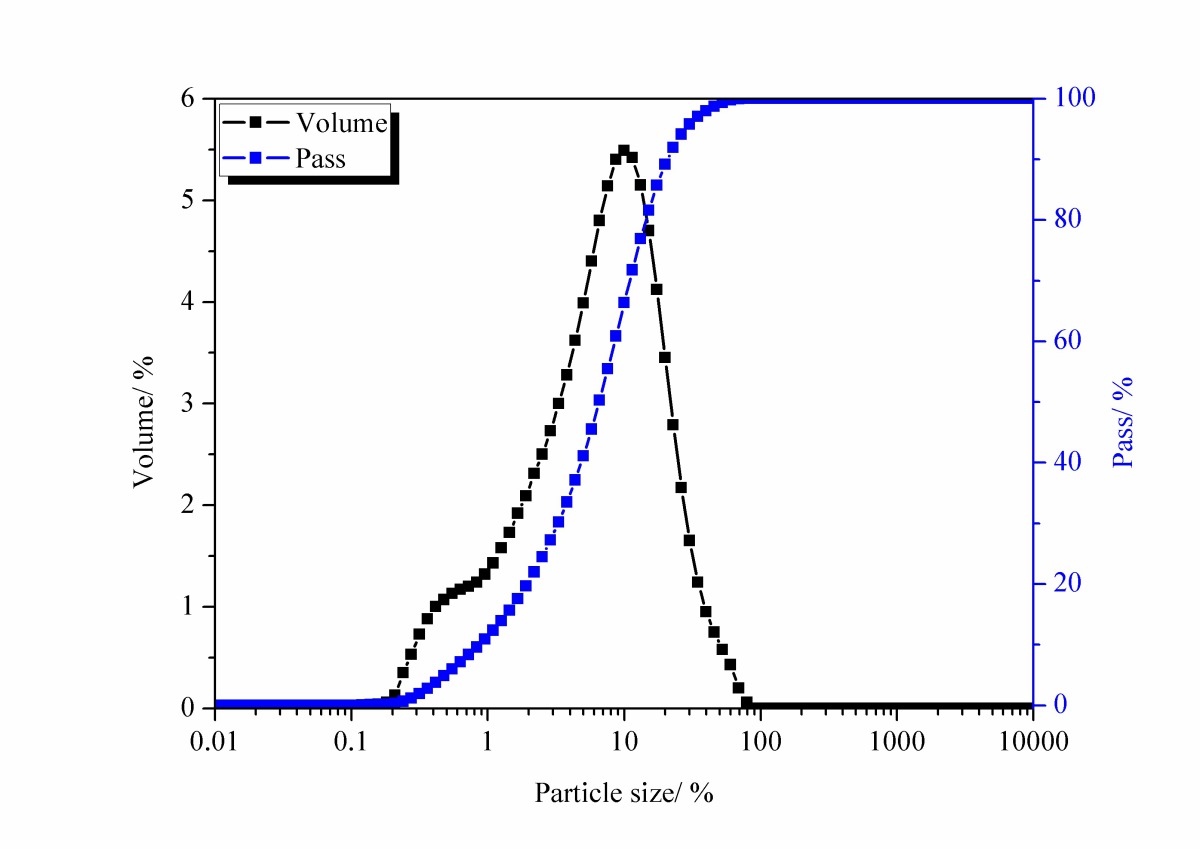
The comparison of crystalline phases and morphology of PG and CPG is shown in Figure 2. It can be noted that calcination has converted the CaSO4·2H2O in PG into CaSO4·0.5H2O and CaSO4. The particle size distributions of raw materials are illustrated in Figure 3. The D50 values of PG and CPG are 49.02 μm and 2.17 μm, respectively, indicating that CPG particles are significantly finer than PG particles. The refinement of particle size is mainly attributed to the volume shrinkage of PG during the dehydration process and the particle fragmentation caused by uneven internal stresses generated under high-temperature conditions.
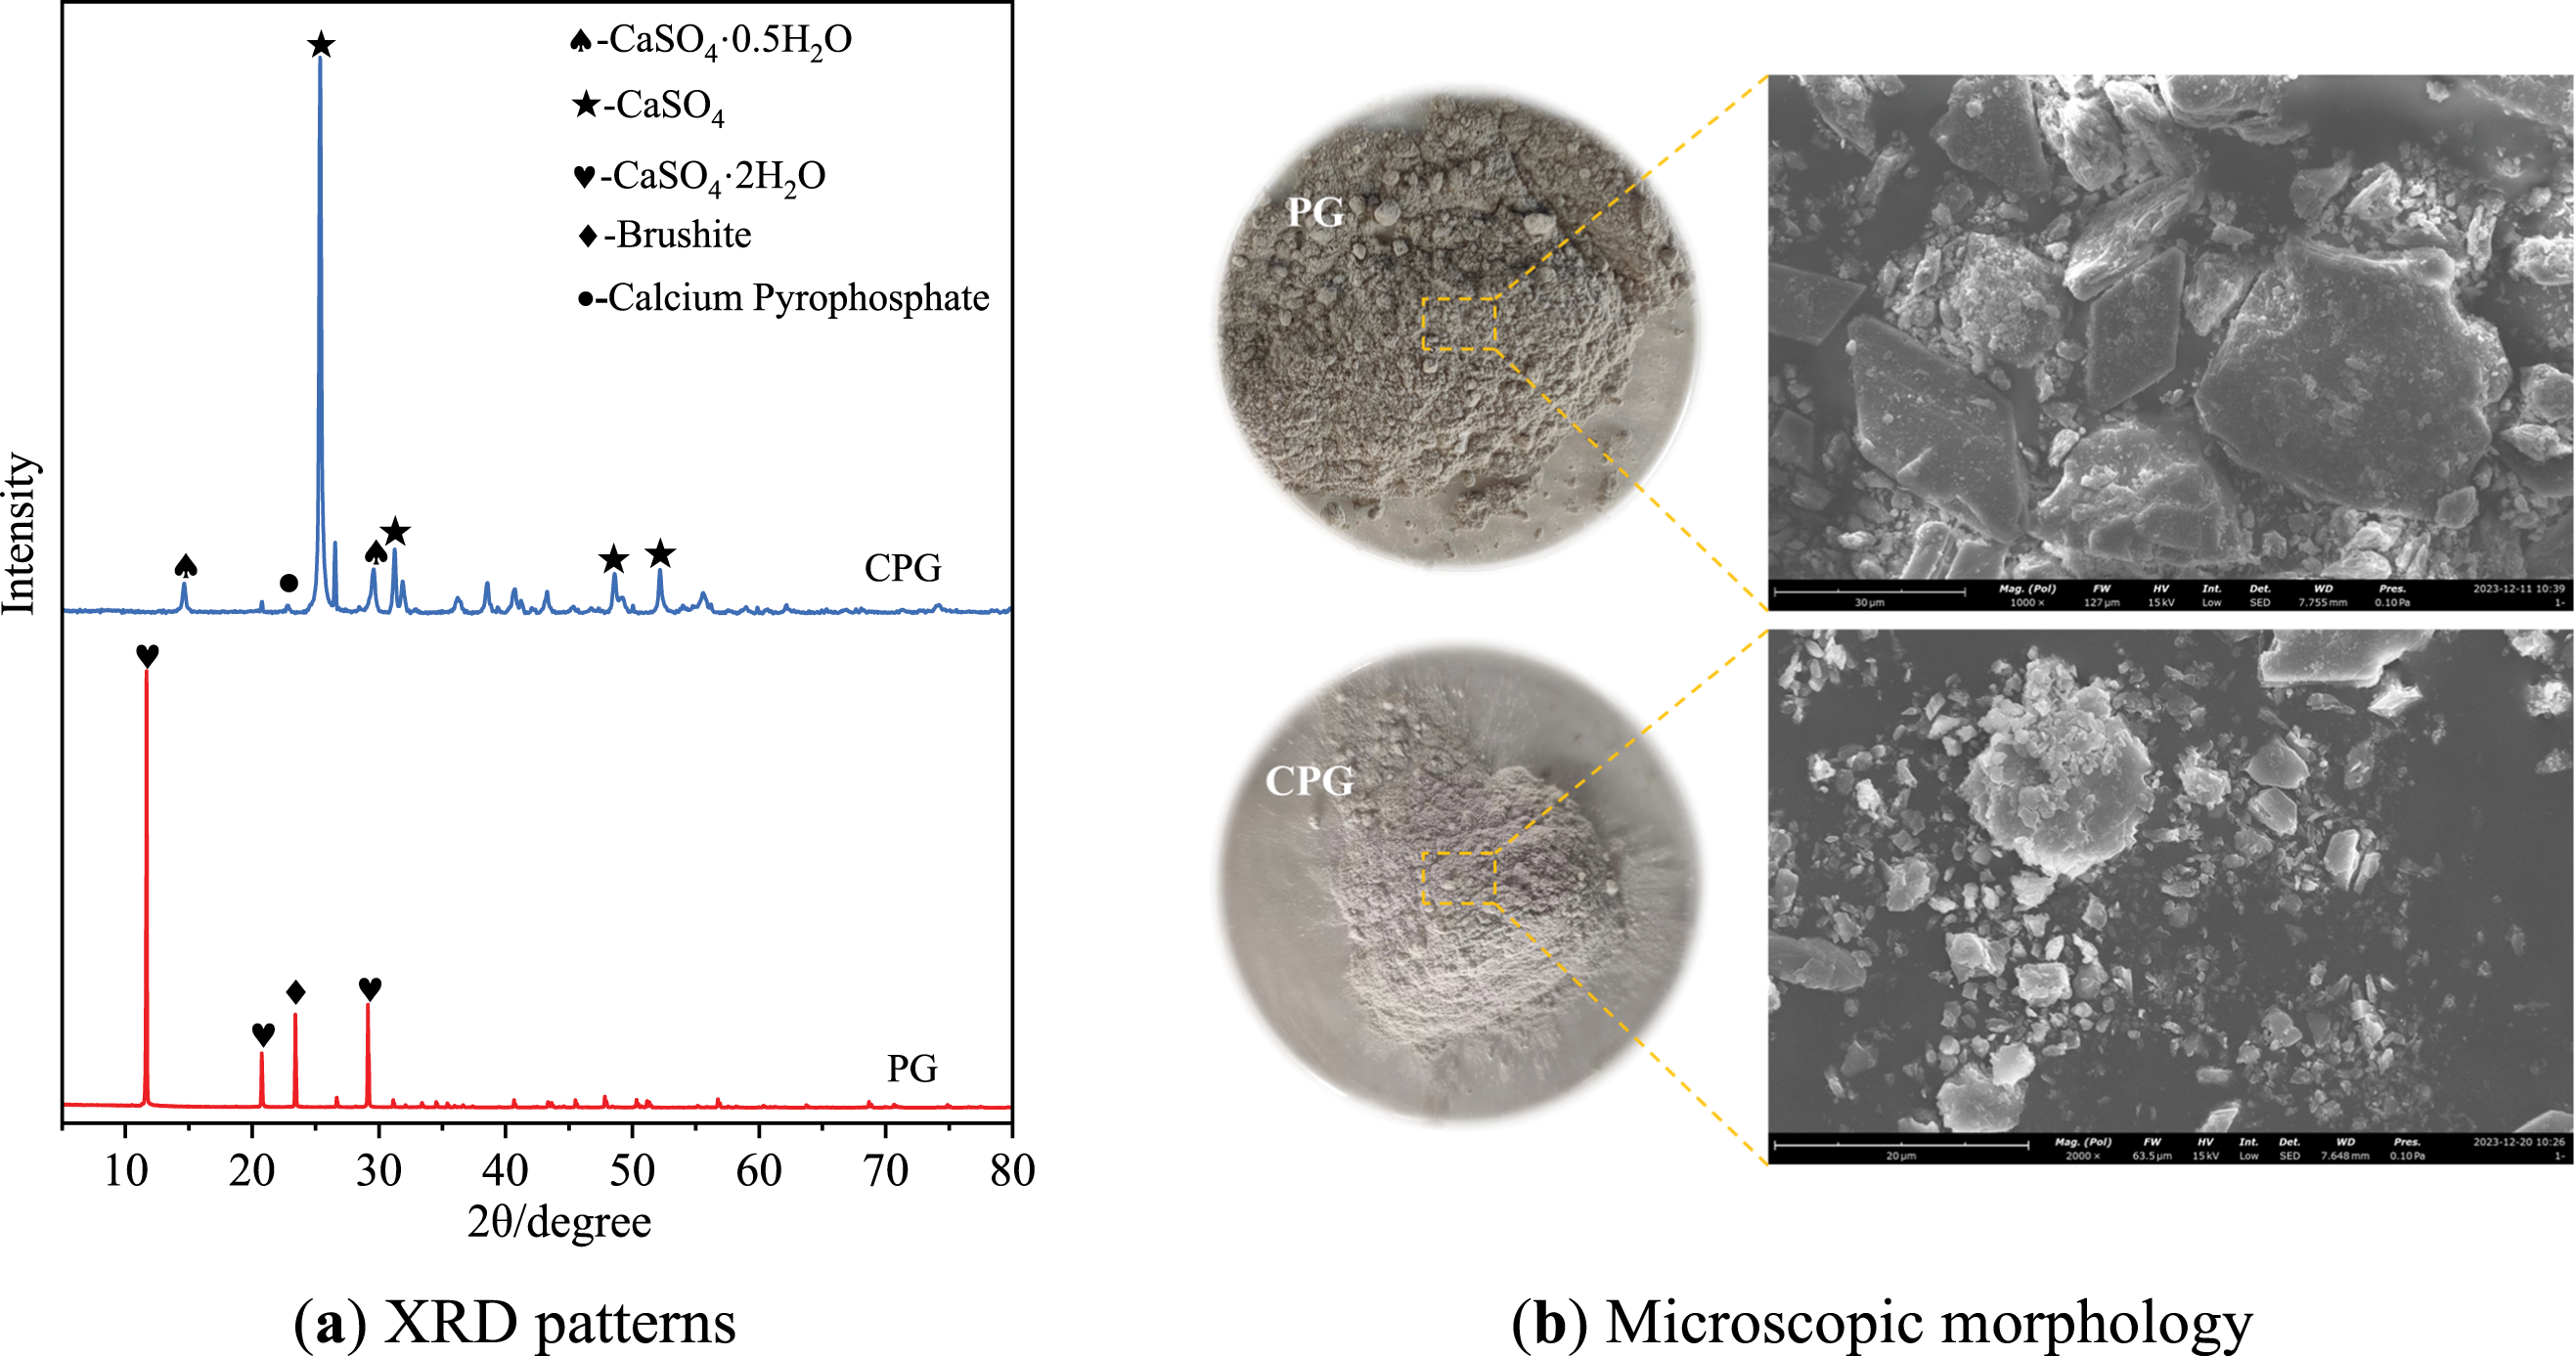
Figure 2 XRD patterns of PG and CPG and their microscopic morphology
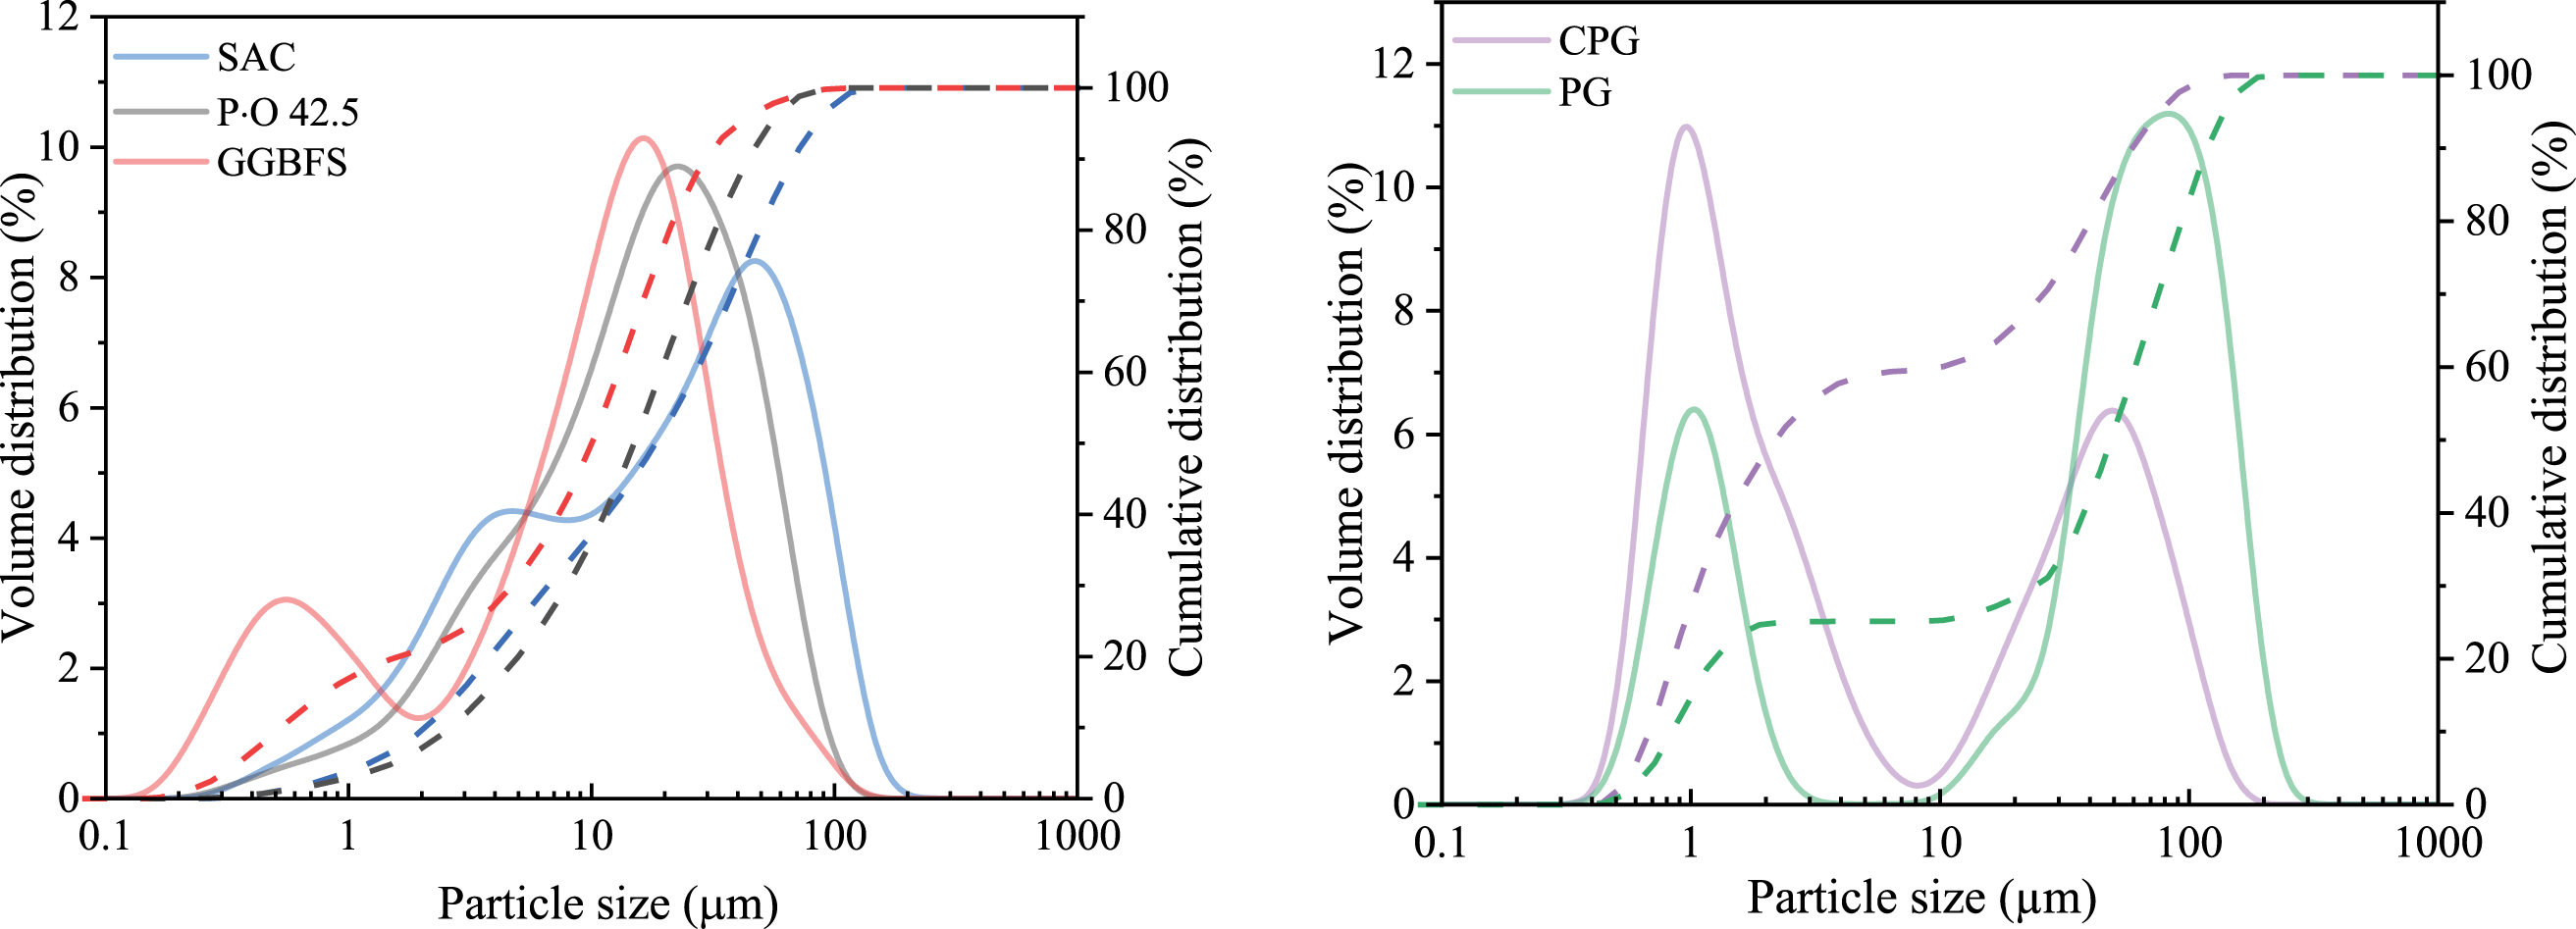
Figure 3 Particle size distribution of raw materials
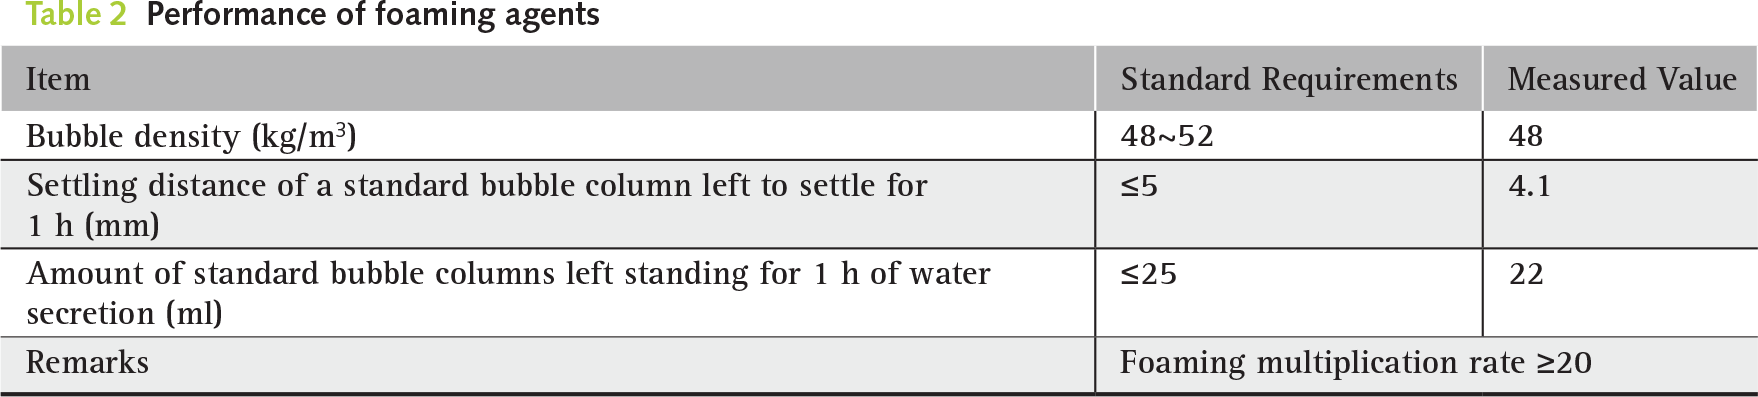
Liquid WG with a modulus of 3.3 was supplied by Shandong Yousuo Chemical Technology Co., Ltd., China. During testing, the WG modulus was adjusted to 1.2 using NaOH (≥96.0% purity), produced by Xilong Science Co., Ltd., China. The NaOH appeared as white, uniform, granular or flake-like solid particles. NaAlO2 was supplied by Shanghai McLean Biochemical Technology Co., Ltd., China, and appeared as a white powder with a purity exceeding 98%. The SC-4 Enhanced Composite Foaming Agent was produced by Guangdong Shoucheng Construction Technology Co., Ltd., China. Its main component is sodium dodecylate, and it has a dilution ratio of 1:100. The performance indicators of the foaming agent were determined according to the Technical Specifications for Aerated Lightweight Soil Backfill Engineering (CJJ/T 177-2012) [34], with the test results shown in Table 2. Polycarboxylic acid-based superplasticizer (SP) supplied by Jiangsu Sobute Co., Ltd., China was used. It has a water reduction rate of 25%. Tap water was used as the water source.
Based on our group’s preliminary experiments [12], the optimal mix ratio was determined to be 60% PG, 15% cement, and 25% slag powder. This study investigates the effect of activators on the properties of PG foam concrete. According to our preliminary experiments, WG content was varied from 1% to 7%, and SA content was varied from 0.3% to 0.6%. CPG was incorporated at 20%, 30%, 40%, and 50% by weight. The wet density of the foam concrete was set to 800 kg/m3, which is commonly used density in subgrade engineering applications. The mix proportions are shown in Table 3.
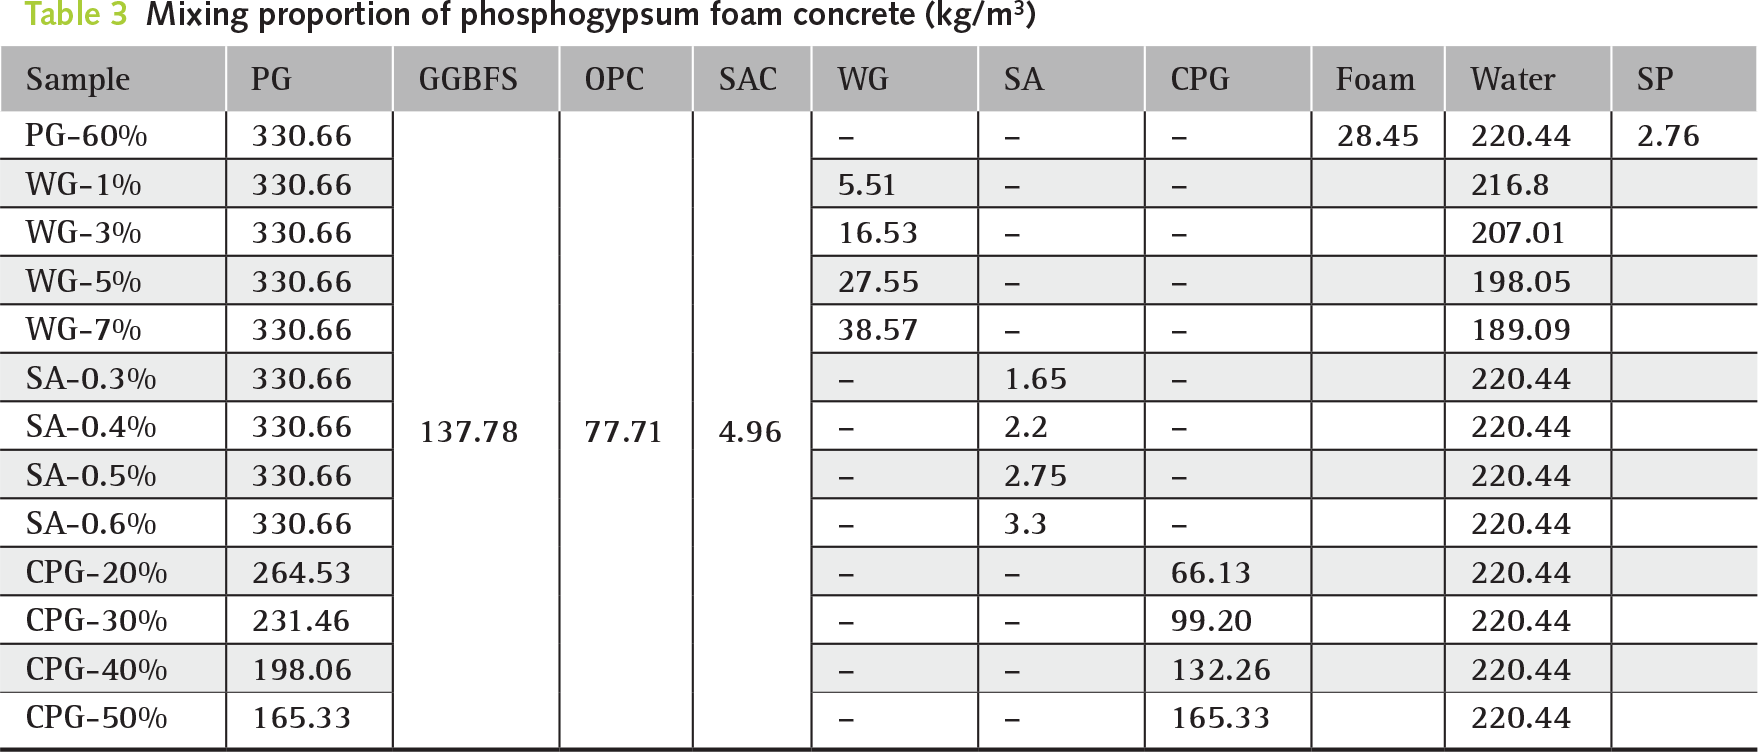
Figure 4 shows the preparation process for PFC specimens. First, PG, OPC, GGBFS, and activator were dry-mixed at 200 rpm for two minutes. Then, water and superplasticizer were added to the mixture, which was stirred for three minutes. A solution was prepared by mixing the foaming agent with water at a ratio of 1:100. The foam generated through mechanical foaming was slowly added to the slurry mixture, which was then mixed and stirred for two minutes. Finally, the foam concrete was poured into 100 mm × 100 mm × 100 mm steel molds. The surface was leveled and plastic film was applied to prevent moisture evaporation during standard curing for four days. After demolding, the specimens were transferred to a standard curing chamber (20°C ± 2°C, relative humidity ≥95%) for sealed curing until specified age.
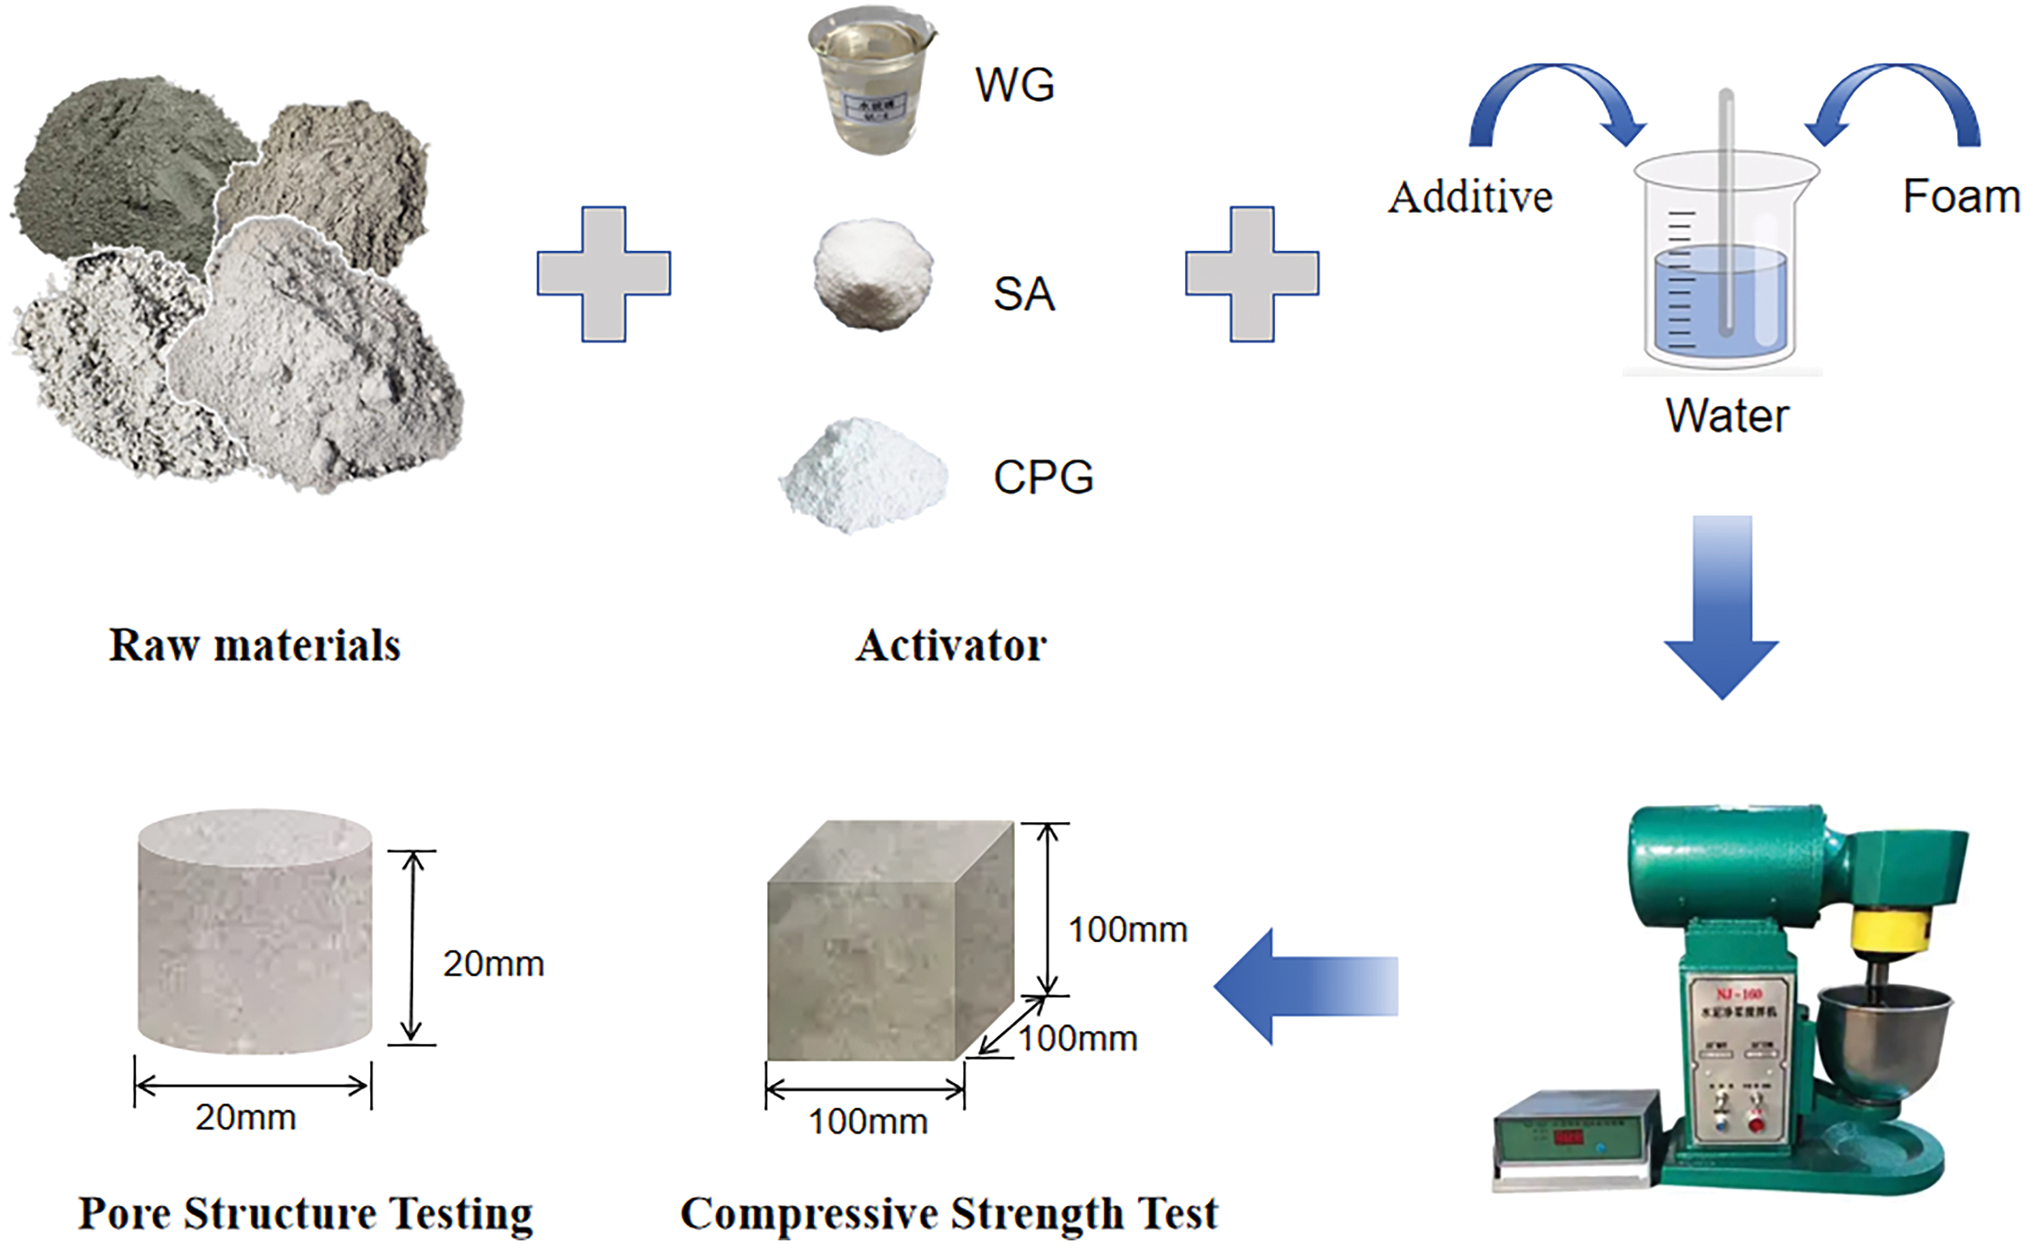
Figure 4 Preparation process of phosphogypsum foam concrete specimens
(1) Fluidity
Fluidity testing was performed in accordance with the Chinese standard CJJ/T177-2012 “Technical Specifications for Bubble-Mixed Lightweight Soil Fill Construction” [35]. The fresh PFC mixture was poured into a cylindrical mold with a diameter and height of 80 mm each. After casting, the mold was gently tapped to ensure complete compaction of foam concrete. Lifting the mold vertically, the mixture was allowed to spread freely for 1 min. The maximum diameter of the slumped foam concrete and its diameter normal to this direction were measured to determine the flow value. Three parallel test results were averaged to ensure data reliability.
(2) Compressive strength
Compressive strength was evaluated following the requirements of CJJ/T 177-2012 [35]. After standard curing to the target age (7 d and 28 d), the 100 mm × 100 mm × 100 mm cubic specimens were tested using a YYW-300DS cement flexural and compressive strength tester (Zhejiang Yiyu Instrument Co., Ltd.). The load was applied continuously and uniformly at a constant rate of 2 kN/s until specimen failure. Three specimens were tested for each mix proportion, and the average compressive strength was calculated with a precision of 0.01 MPa.
(3) Fourier transform infrared spectroscopy (FTIR)
Infrared spectroscopy detects molecular structures and chemical bonds within samples. In cementitious materials, infrared analysis allows for a semi-quantitative evaluation of chemical bonds by measuring spectral intensity to determine the relative changes in the content of functional groups, thus analyzing the composition of the hydration products in the mixture. For this study, an infrared spectrometer (Nicolet 6700, ThermoFisher Technologies) was used to perform potassium bromide pellet testing on the samples hydrated for 28 d. The sample was mixed with pure potassium bromide at a mass ratio of 1:100 and ground under an infrared lamp for four to five minutes. The mixed powder was then pressed into tablet molds at 10 MPa for approximately 1 min. Mid-to-far infrared light was used, and the test wavenumber range was set to 4000–400 cm−1.
(4) Heat of hydration
This is a key method for quantifying the exothermic characteristics of cementitious materials during hydration. Isothermal calorimetry continuously monitors the heat flux rate and cumulative heat release of the cementitious material during hydration to obtain the hydration heat release curve. The resulting data can be used to analyze the hydration rate and optimize the mix design. The experiment employs an eight-channel hydration calorimeter, maintaining the water bath temperature at 20°C ± 0.1°C and setting the vacuum flask volume to 650 mL.
(5) LF-NMR
Pore structure parameters of 28 d aged specimens were tested using LF-NMR with the MacroMR12-150H-I large-scale NMR high-temperature/high-pressure imaging system. The NMR analyzer, manufactured by Nuomei Analytical Instruments Co., Ltd., has a resonance frequency of 12.798 MHz, a permanent magnet with a magnetic field strength of 0.3 T, a drive coil diameter of 100 mm, and can accommodate a maximum sample diameter of 25 mm. The magnet temperature was maintained at 32°C to ensure the stability and accuracy of the magnetic field. Routine instrument calibration was performed prior to testing. Due to the low strength and high porosity of PFC, vacuum impregnation was employed prior to testing.
Figure 5 illustrates the impact of activators on the fluidity and wet apparent density of PFC. The incorporation of all activators resulted in rapid hydration reactions, which significantly reduced the free water content, thickened the paste, and decreased the fluidity. Adding WG decreased fluidity from 194 mm to 175 mm and increased wet density from 814.6 kg/m3 to 819.6 kg/m3, though the increase was relatively small. This is attributed to the foam collapse during mixing [36]. With the addition of SA, fluidity decreased from 192 mm to 160 mm while wet density increased from 800.2 kg/m3 to 826.8 kg/m3. This compound had a greater influence on the fluidity and wet density of PFC, likely due to its more pronounced activation effect and increased foam collapse. Meanwhile, calcined PG had a reduced particle size, an increased specific surface area, and a decreased crystalline water content. As CPG dosage increased, slump decreased from 190 mm to 143 mm while wet density increased from 825.4 kg/m3 to 838.3 kg/m3. The loss in fluidity and the increase in density were more pronounced. When the CPG replacement rate reached 50%, the fluidity of the foam concrete fell below the minimum requirement for pumped placement.
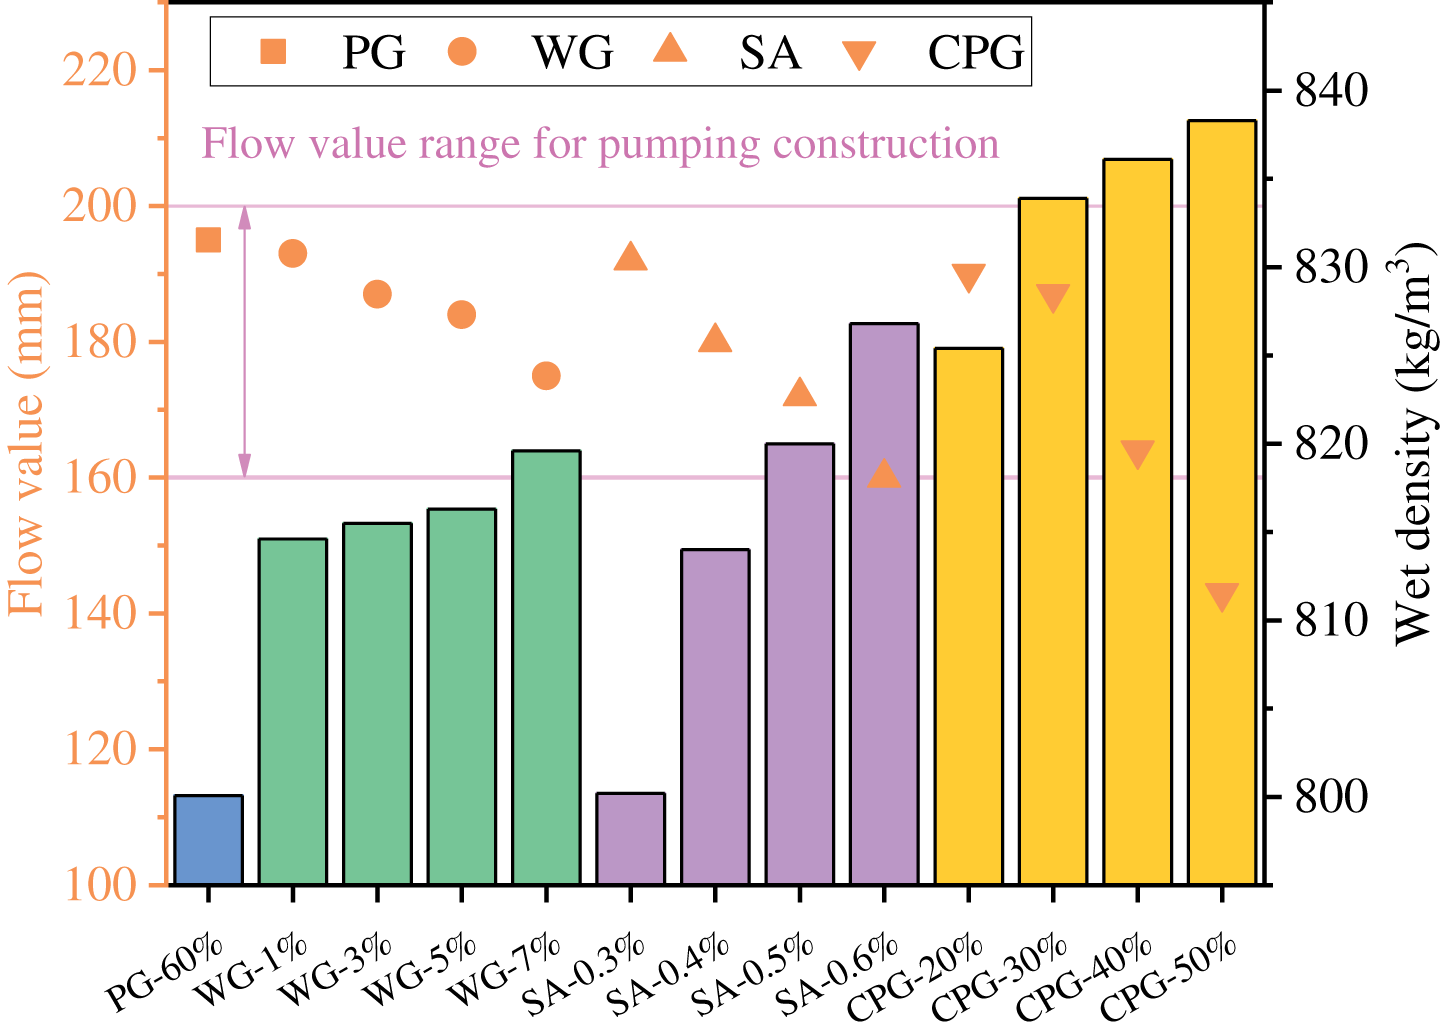
Figure 5 Effect of activators on the flow of phosphogypsum foam concrete
Figure 6 illustrates the impact of various activators on the mechanical properties of PFC after 7 and 28 days. Compared to the control without an activator, the three activator groups exhibit similar compressive strength trends-initially increasing and then decreasing. These results are consistent with the findings of Labaied et al. [37] and indicate that activators significantly influence compressive strength. At a dosage of 1%, WG increased the compressive strength to 0.80 MPa at 7 days and 1.12 MPa at 28 days. The strength enhancement effect of waterglass is attributed to its “colloidal bonding” role. The high OH− concentration in waterglass facilitates the dissolution of aluminosilicate phases and calcium ions from GGBFS. These dissolved ions react with PG to form C-S-H gel and alumina-ferric-trisulfate (Aft) crystals, which fill the internal pores of PFC and improve the structural integrity. With the addition of 0.4% SA, the compressive strength increased to 0.90 MPa and 1.56 MPa at 7 and 28 days, respectively. This is due to the fact that hydrolysis produces OH− and AlO2− ions. The slag powder’s hydrolysis also promotes pozzolanic reactions that generate C-S-H gel, which provides strength. As hydration progresses, the quantity of hydration products continuously increases, gradually filling internal pores. CPG at a 30% dosage increased the 7 d compressive strength to 1.00 MPa. At a 20% dosage, the 28 d compressive strength peaked at 1.30 MPa. In our experiment, the primary purpose CPG replacement is to utilize the self-hydration and hardening capacity of CPG, enabling the foamed concrete to develop early strength. CPG is derived from PG through additional processing, which incurs extra energy consumption during calcination. Nevertheless, partial CPG replacement is beneficial to the strength of foamed concrete.
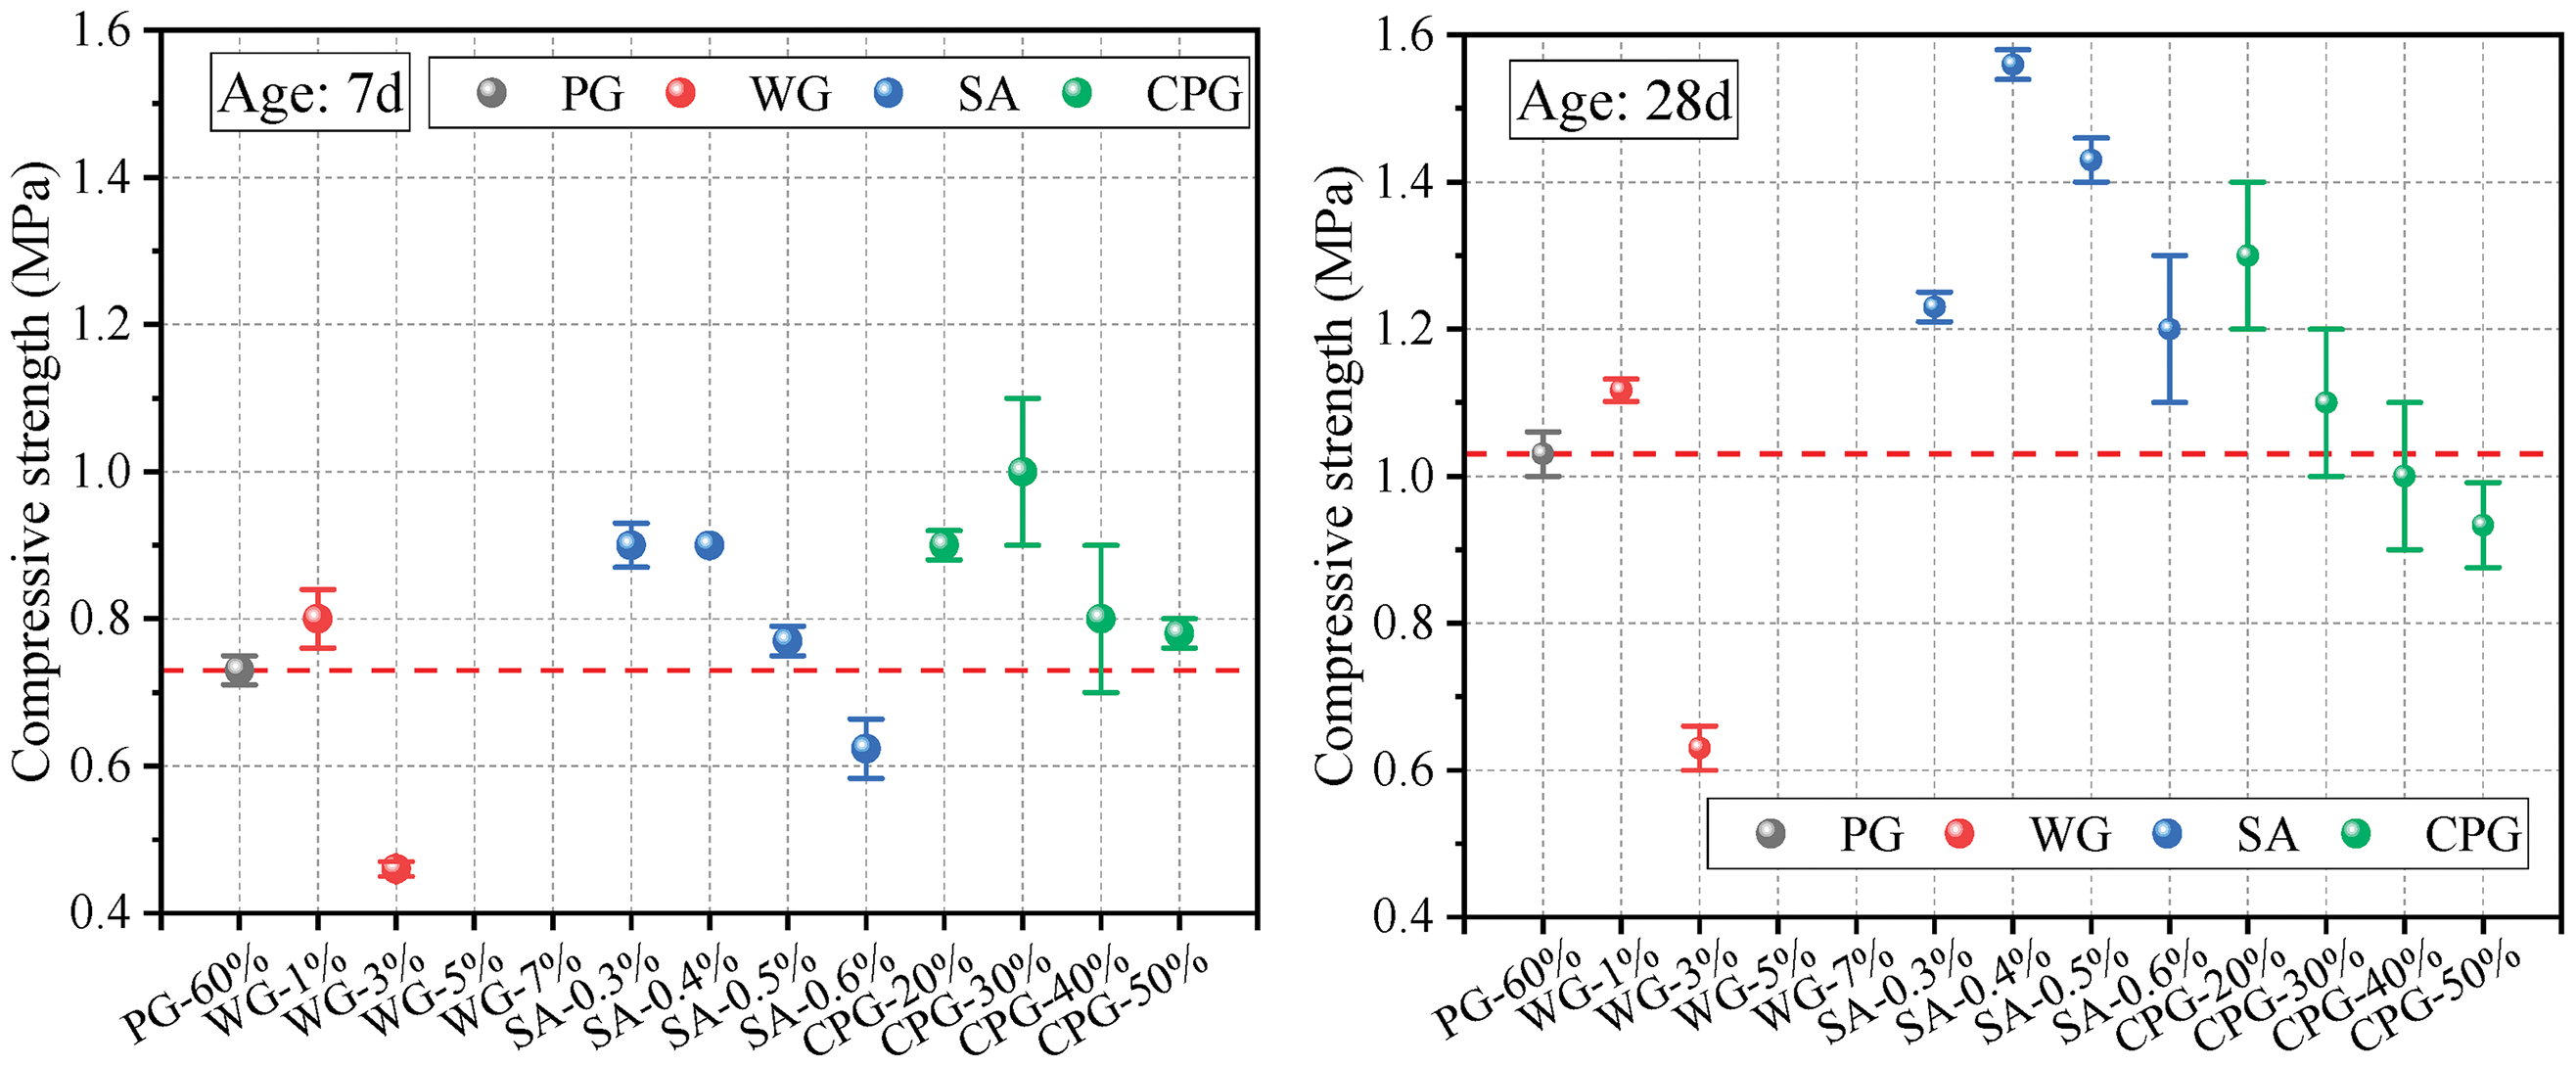
Figure 6 Effect of activators on compressive strength of PFC
Excessive admixture content primarily reduces strength due to overly potent WG activation. Elevated NaOH concentrations induce electrostatic shielding effects that inhibit polymerization. Additionally, increased calcium hydroxide formation creates films on particle surfaces, which disrupts gel continuity and hinders strength development. Consequently, at a 7% admixture level, the excessive bonding density caused the specimen to fail during formwork removal [38]. Excessive addition of SA increases the slurry water demand, causing the freshly mixed slurry to thicken and become difficult to pour into compact blocks, resulting in reduced strength. For AAMs, a high dosage of alkali activators generally causes retardation of hydration and thus a reduction in strength [39]. In the case of foamed concrete, high alkalinity also causes foam instability and collapse, leading to the formation of more larger pores and further degradation of compressive strength [36]. As the content of CPG rises, the generated dihydrate gypsum becomes insufficient to react with other substances. This leads to reduced calcium aluminate hydrate formation, consequently diminishing strength [33].
In summary, all three activators demonstrate optimal dosage levels. The mixture demonstrates excellent compressive strength and fluidity when WG, SA, and calcined aluminate are added at 1%, 0.4%, and 20%, respectively. Further analysis of these optimal dosage levels will be conducted subsequently.
FTIR was used to analyze PG-based cementitious slurries and study the resulting hydration products. Figure 7 shows the FTIR spectrum of PFC after 28 days. The following characteristic bands were detected in all groups: 980 cm−1 (asymmetric stretching vibration of Si-O), 667 cm−1 (out-of-plane bending vibration of Si-O-Si), and 466 cm−1 (asymmetric bending vibration of Si-O-Si). These bands are attributed to the formation of C-S-H gel [40, 41]. While these bands may also be due to the presence of silica, C-S-H gel is the primary source. Previous studies indicate that, when aluminum replaces silicon (Si) in the C-S-H gel and undergoes polymerization, additional spectral bands appear at 800–880 cm−1 (aluminum-oxygen (Al-O)-silicon (Si) stretching) and 1050 cm−1 (aluminum-oxygen (Al-O)-hydrogen (H) symmetric bending) [42]. However, due to the presence of gypsum and calcium carbonate, along with interference from other phases, these bands were not identified in the aforementioned groupings. AFt adopts a columnar structure containing sulfate ions and water molecules with characteristic bands at 1112–1115 cm−1 and 1675–1686 cm−1 [41, 43]. In the present samples, distinct AFt vibration bands were observed at 1118 cm−1 (corresponding to the asymmetric stretching vibration of S-O) and 1683 cm−1 (corresponding to the in-plane bending vibration of H-O-H). The characteristic gypsum bands appear at 599 cm−1 (out-of-plane bending of S-O), 1620 cm−1 (in-plane bending of H-O-H), 3245 cm−1 (in-plane bending of H-O-H), 3403 cm−1 (symmetric stretching of H-O-H), and 3546 cm−1 (out-of-plane bending of H-O-H). These bands were detected in all samples, indicating that the 28-day sample retained a significant amount of unreacted gypsum [44]. Additionally, the spectral bands at 874 cm−1 and 1425 cm−1 correspond to the in-plane bending and asymmetric bending vibrations of C-O in calcium carbonate, respectively.
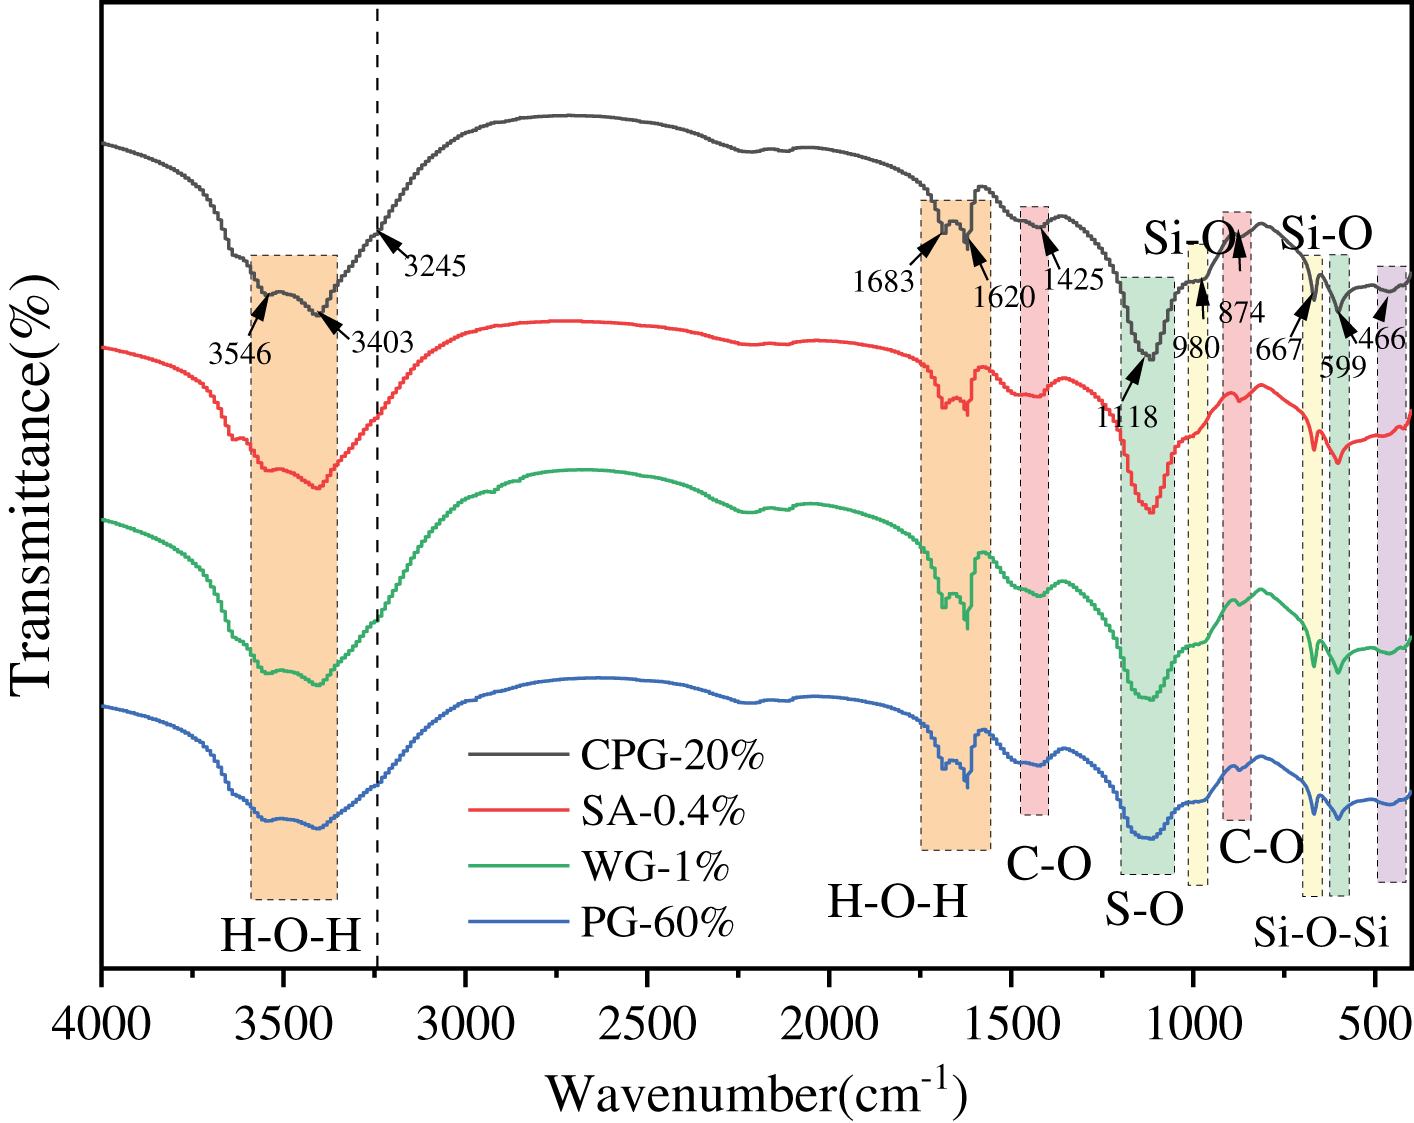
Figure 7 FTIR profiles of phosphogypsum foam concrete at 28 d age
3.4 Hydration exothermic property
3.4.1 Exothermic evolution of hydration
Figure 8 illustrates the 24-h hydration heat release rate and cumulative heat release curves of PFC with various activators. The hydration process generally consists of five stages: the rapid reaction period, the induction period, the acceleration period, the deceleration period, and the decay period. Two distinct exothermic peaks are observed in the hydration heat release curve of PFC (Figure 8a). The first peak appears in the pre-induction stage, which is mainly attributed to the reaction between tricalcium aluminate (C3A) from cement and PG, leading to the formation of ettringite The second peak corresponds to the acceleration period of hydration, and its formation is primarily associated with the hydration reactions of tricalcium silicate (C3S) and dicalcium silicate (C2S) in cement and GGBFS, which generate C-S-H gel.
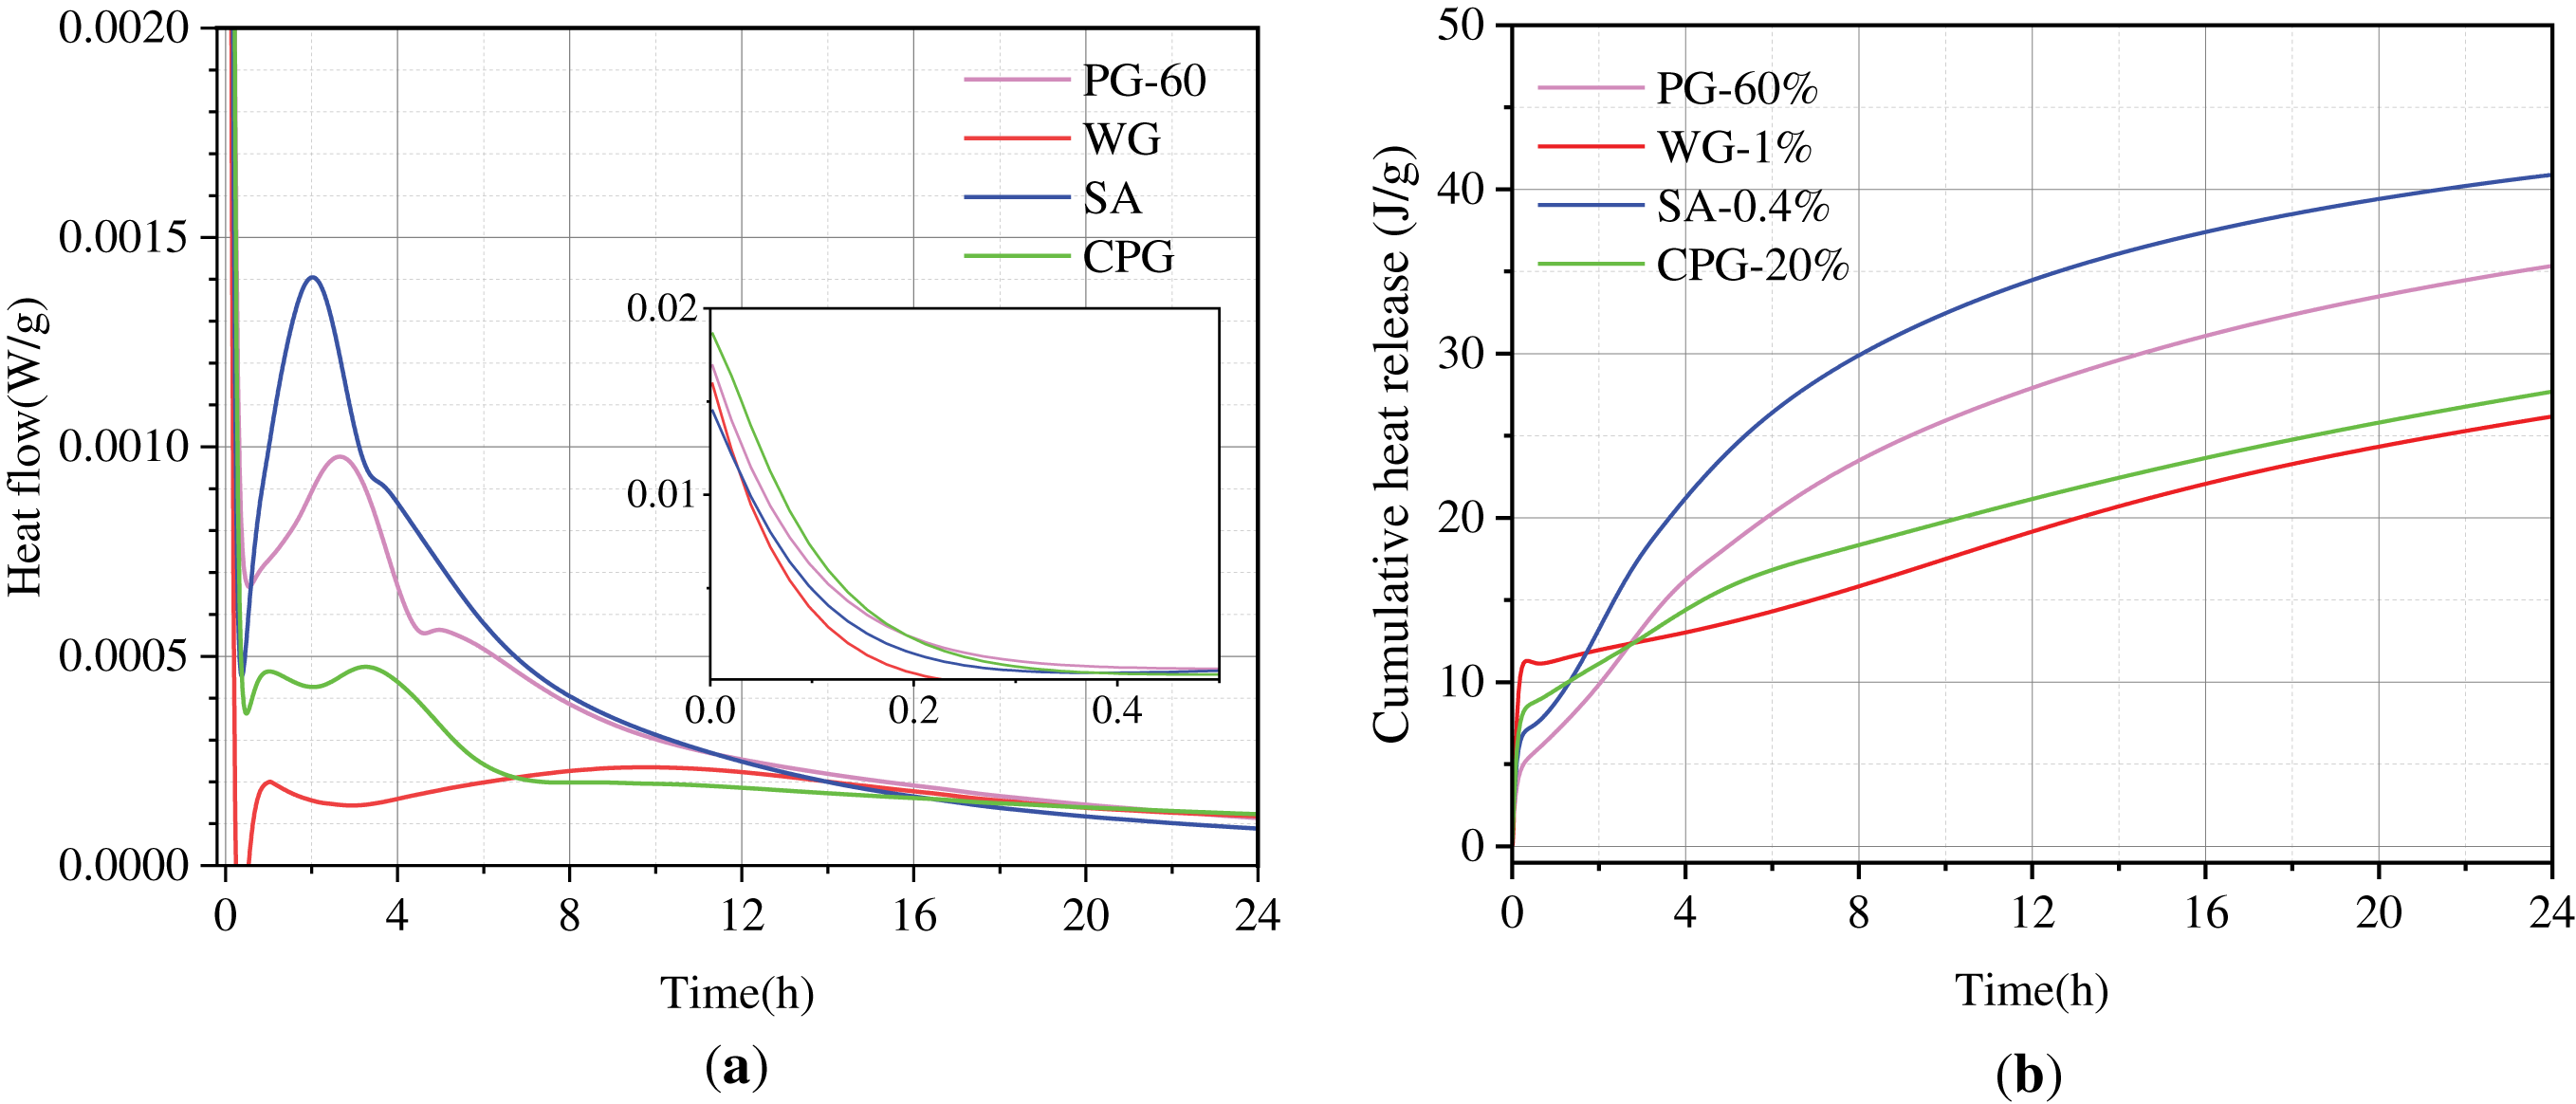
Figure 8 (a) Exothermic rates of hydration for different activators and (b) cumulative total exotherm of different activators
The three activators had a minimal impact on the initial peak, yet significantly influenced the value and timing of the subsequent peak. Adding WG caused the generated hydration products to encapsulate the unhydrated PG. This inhibited further reaction, prolonged the induction period, and reduced the hydration rate. SA significantly impacts the exothermic hydration reaction of PFC. It shortens the induction period while markedly increasing the hydration exothermic rate and the peak value of the maximum exothermic peak. This is consistent with compressive strength. A layer of molten material covers the calcined PG surface, hindering contact with water and leading to a reduced dissolution rate and consequently a lower hydration rate.
Based on FTIR analysis, the heat release rate and quantity follow this order: SA-0.4% > PG-60% > CPG-20% > WG-1%. The primary reasons for this phenomenon are as follows: The addition of SA supplements aluminum ions and provides AlO2− ions, which directly participate in the hydration reaction of C3A. This promotes the rapid formation of calcium aluminate hydrate (Ca(OH)2). Since calcined gypsum formation is an exothermic reaction, it significantly increases early heat release. Additionally, the alkaline environment accelerates hydration by releasing OH− ions when dissolved in water. This raises the pH, accelerating the hydrolysis of silicate minerals (C3S and C2S) and releasing more heat. In contrast, heat release in the unmodified system is primarily due to cement hydration because cement plays a dominant role in this system. Conversely, the weaker alkaline environment slows the activation rate of slag powder and contributes less to heat release. CPG provides sulfate ions, which promote the formation of calcium aluminate hydrate. However, insufficient aluminum ions in the system, limited by the amount of dissolved aluminum from the slag powder, restrict calcium aluminate hydrate formation. Additionally, excess sulfate ions adsorb onto cement particle surfaces, retarding hydration. Furthermore, silicate ions released from WG react with calcium ions to form a C-S-H gel that coats the cement particles, impeding hydration and resulting in low heat release. Overall, adding WG-1% and CPG-20% reduces the reaction rate and total heat release, whereas adding SA-0.4% increases both the reaction rate and total heat release.
3.4.2 Hydration kinetics simulation
The relationship between the hydration heat release rate (dQ/dt), the cumulative heat release (Q), and the reaction time (t) can be obtained through isothermal calorimetry. Equations. (2)–(3) are used to calculate Qmax, t50, the degree of hydration (α), and the hydration rate (dα/dt). The formulas are as follows:
The simplest method for determining Qmax is to use the extrapolation formula proposed by Knudsen [45], as shown in Equation (4):
where Q is the cumulative heat release corresponding to the hydration time t (J/g); Qmax is the total heat released by the cement at the end of hydration (i.e., the theoretical maximum heat release) (J/g); t50 is the reaction time required for the heat release to reach half of Qmax, (h).
The Krstulovic-Dabic model [46] offers a thorough and systematic analysis of the hydration process in cementitious materials. According to the model, cement hydration comprises three fundamental processes: nucleation and growth (NG), interfacial reactions (I), and diffusion (D). While these stages may occur simultaneously, the overall hydration rate is typically determined by the slowest process. The rate expressions for each stage are given by Equations (5)–(7):
Nucleation and growth (NG):
Interfacial reactions (I):
Diffusion (D):
NG process differential form
I process differential form
D process differential form
where α is the degree of hydration; n is the geometric crystal growth index; t is the hydration time; t0 is the end time of the induction period; γ is the radius of the reactant particles; Ki is the reaction rate constant; Ki′ is the apparent reaction rate constant; Fi(α) is the reaction mechanism function.
The Knudsen extrapolation equation reasonably predicts the upper limit of energy release in hydration reactions. The Krstulovic-Dabic model was used to determine the reaction rate constants and orders for each stage, as illustrated in Figures 9–12.
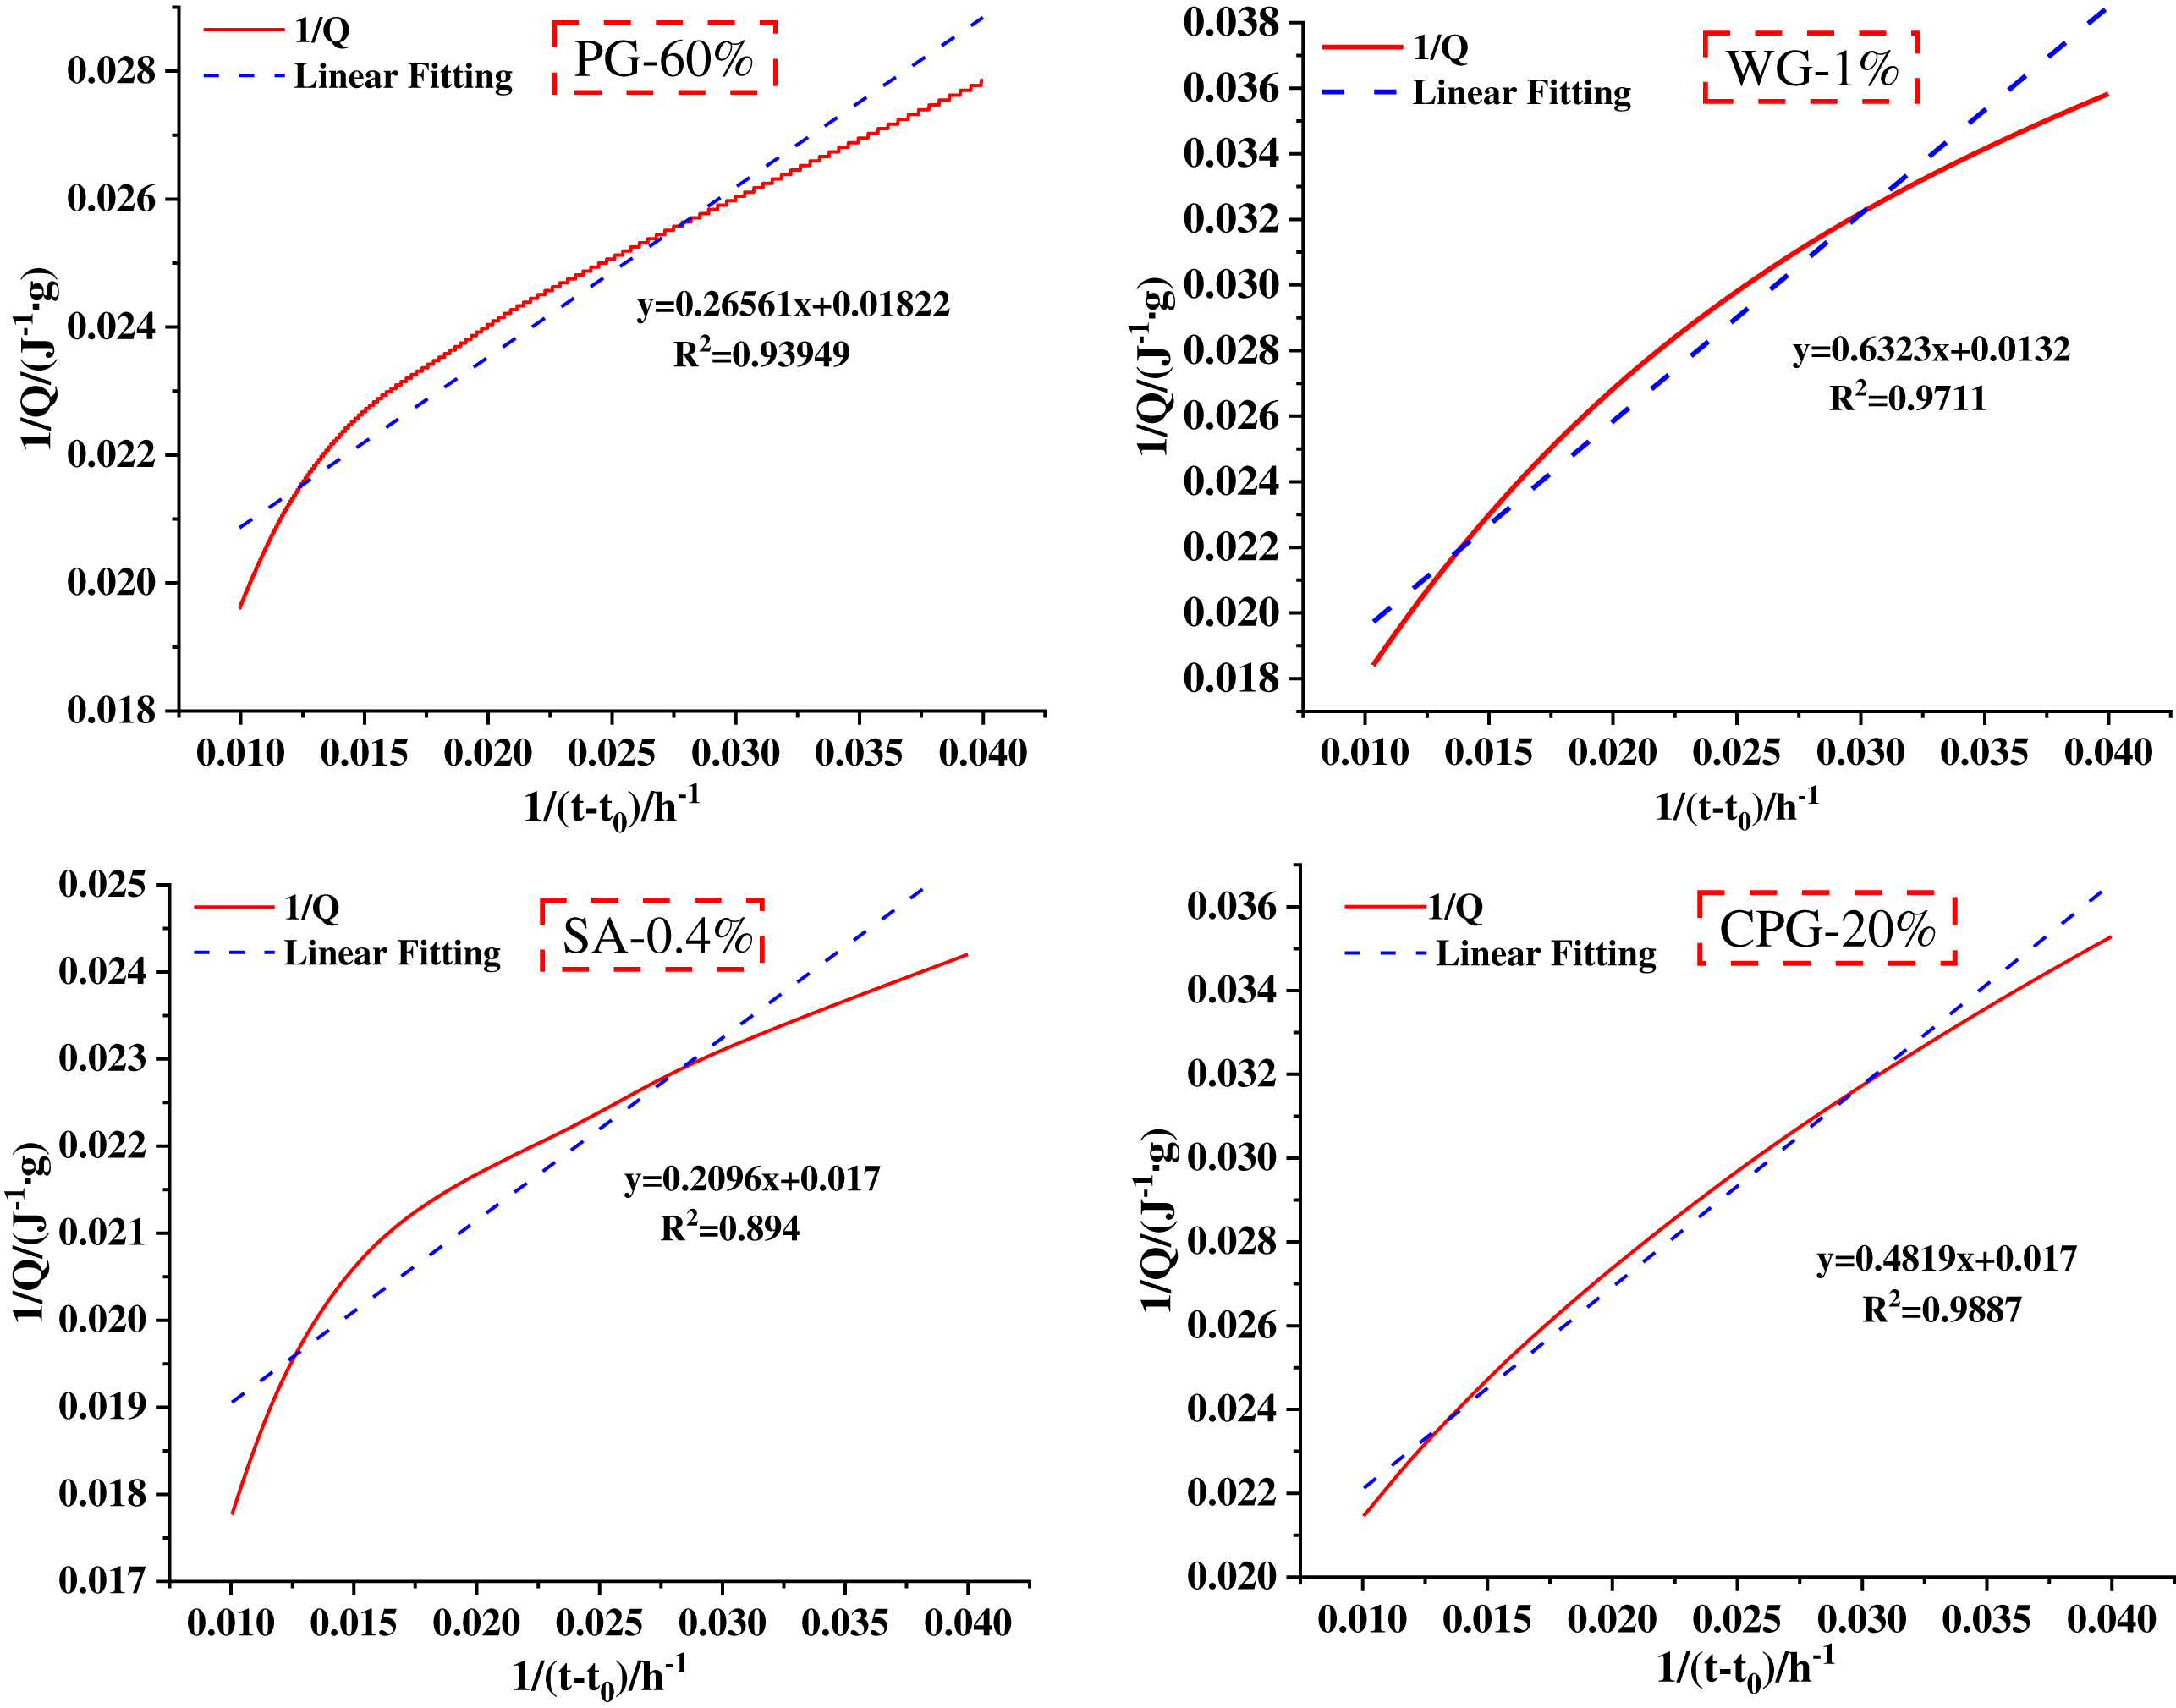
Figure 9 Linear fit for maximum hydration heat release (Qmax)
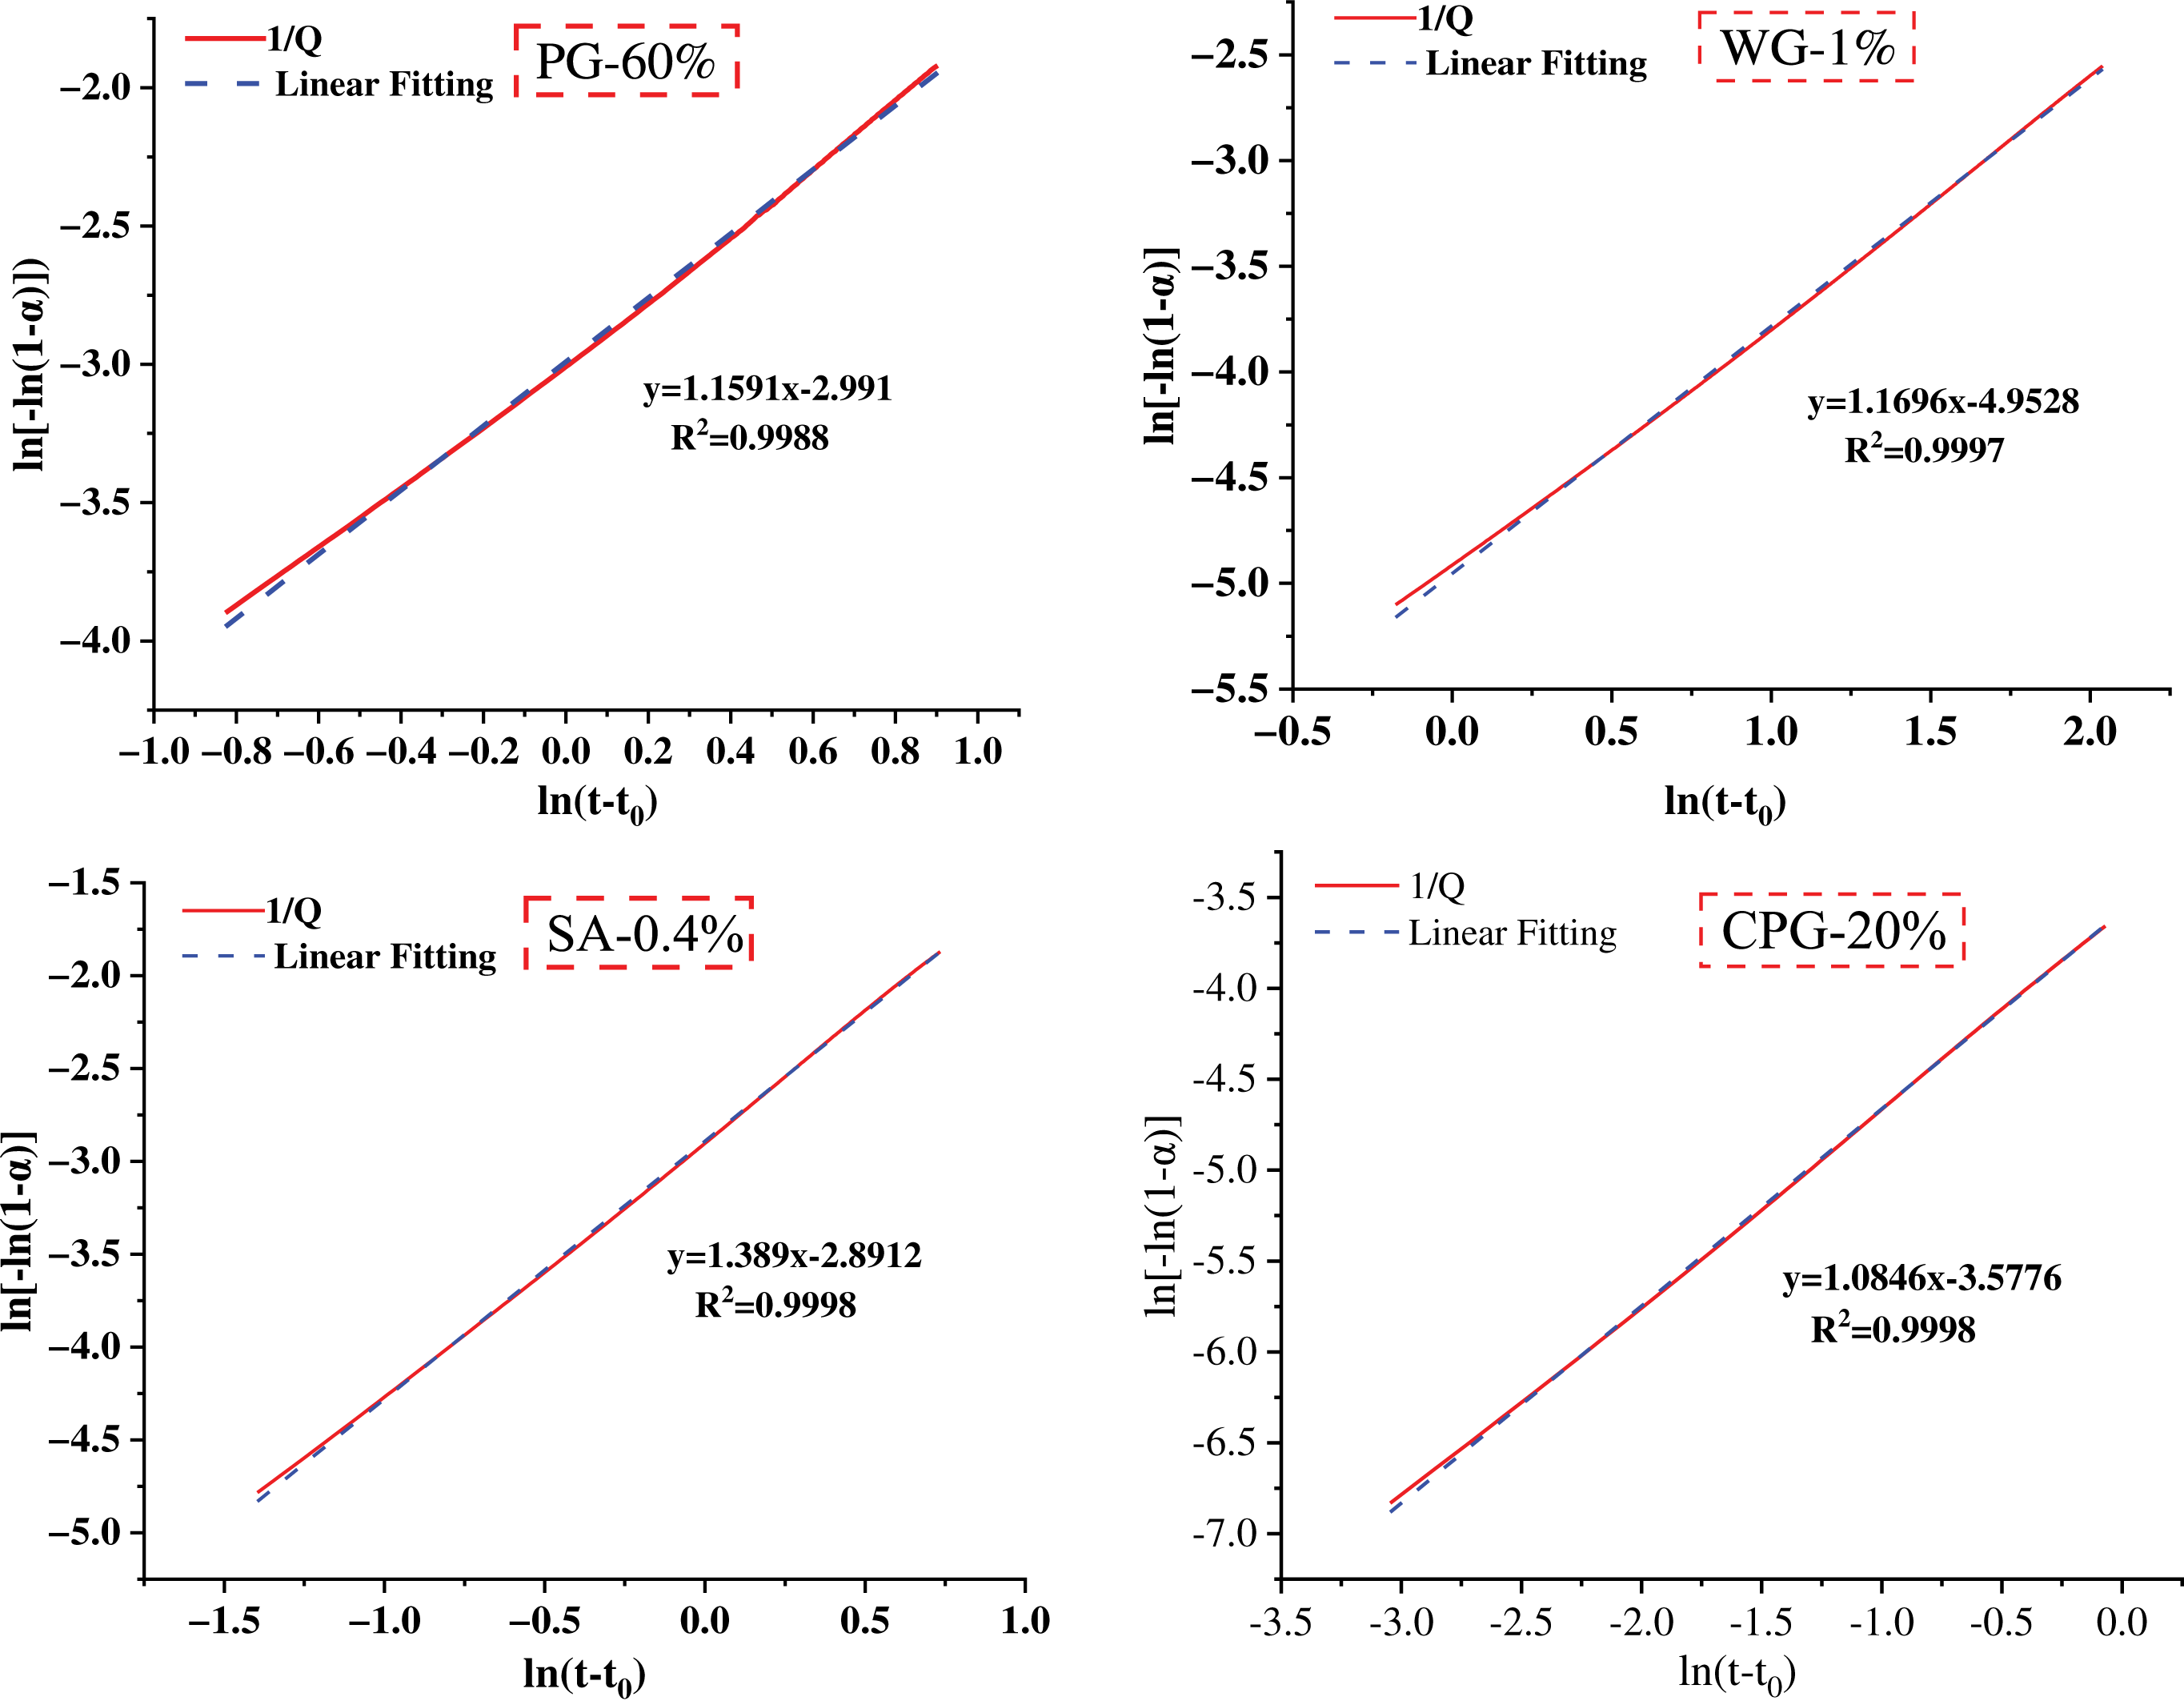
Figure 10 Linear fitting to find the kinetic parameters of the NG process
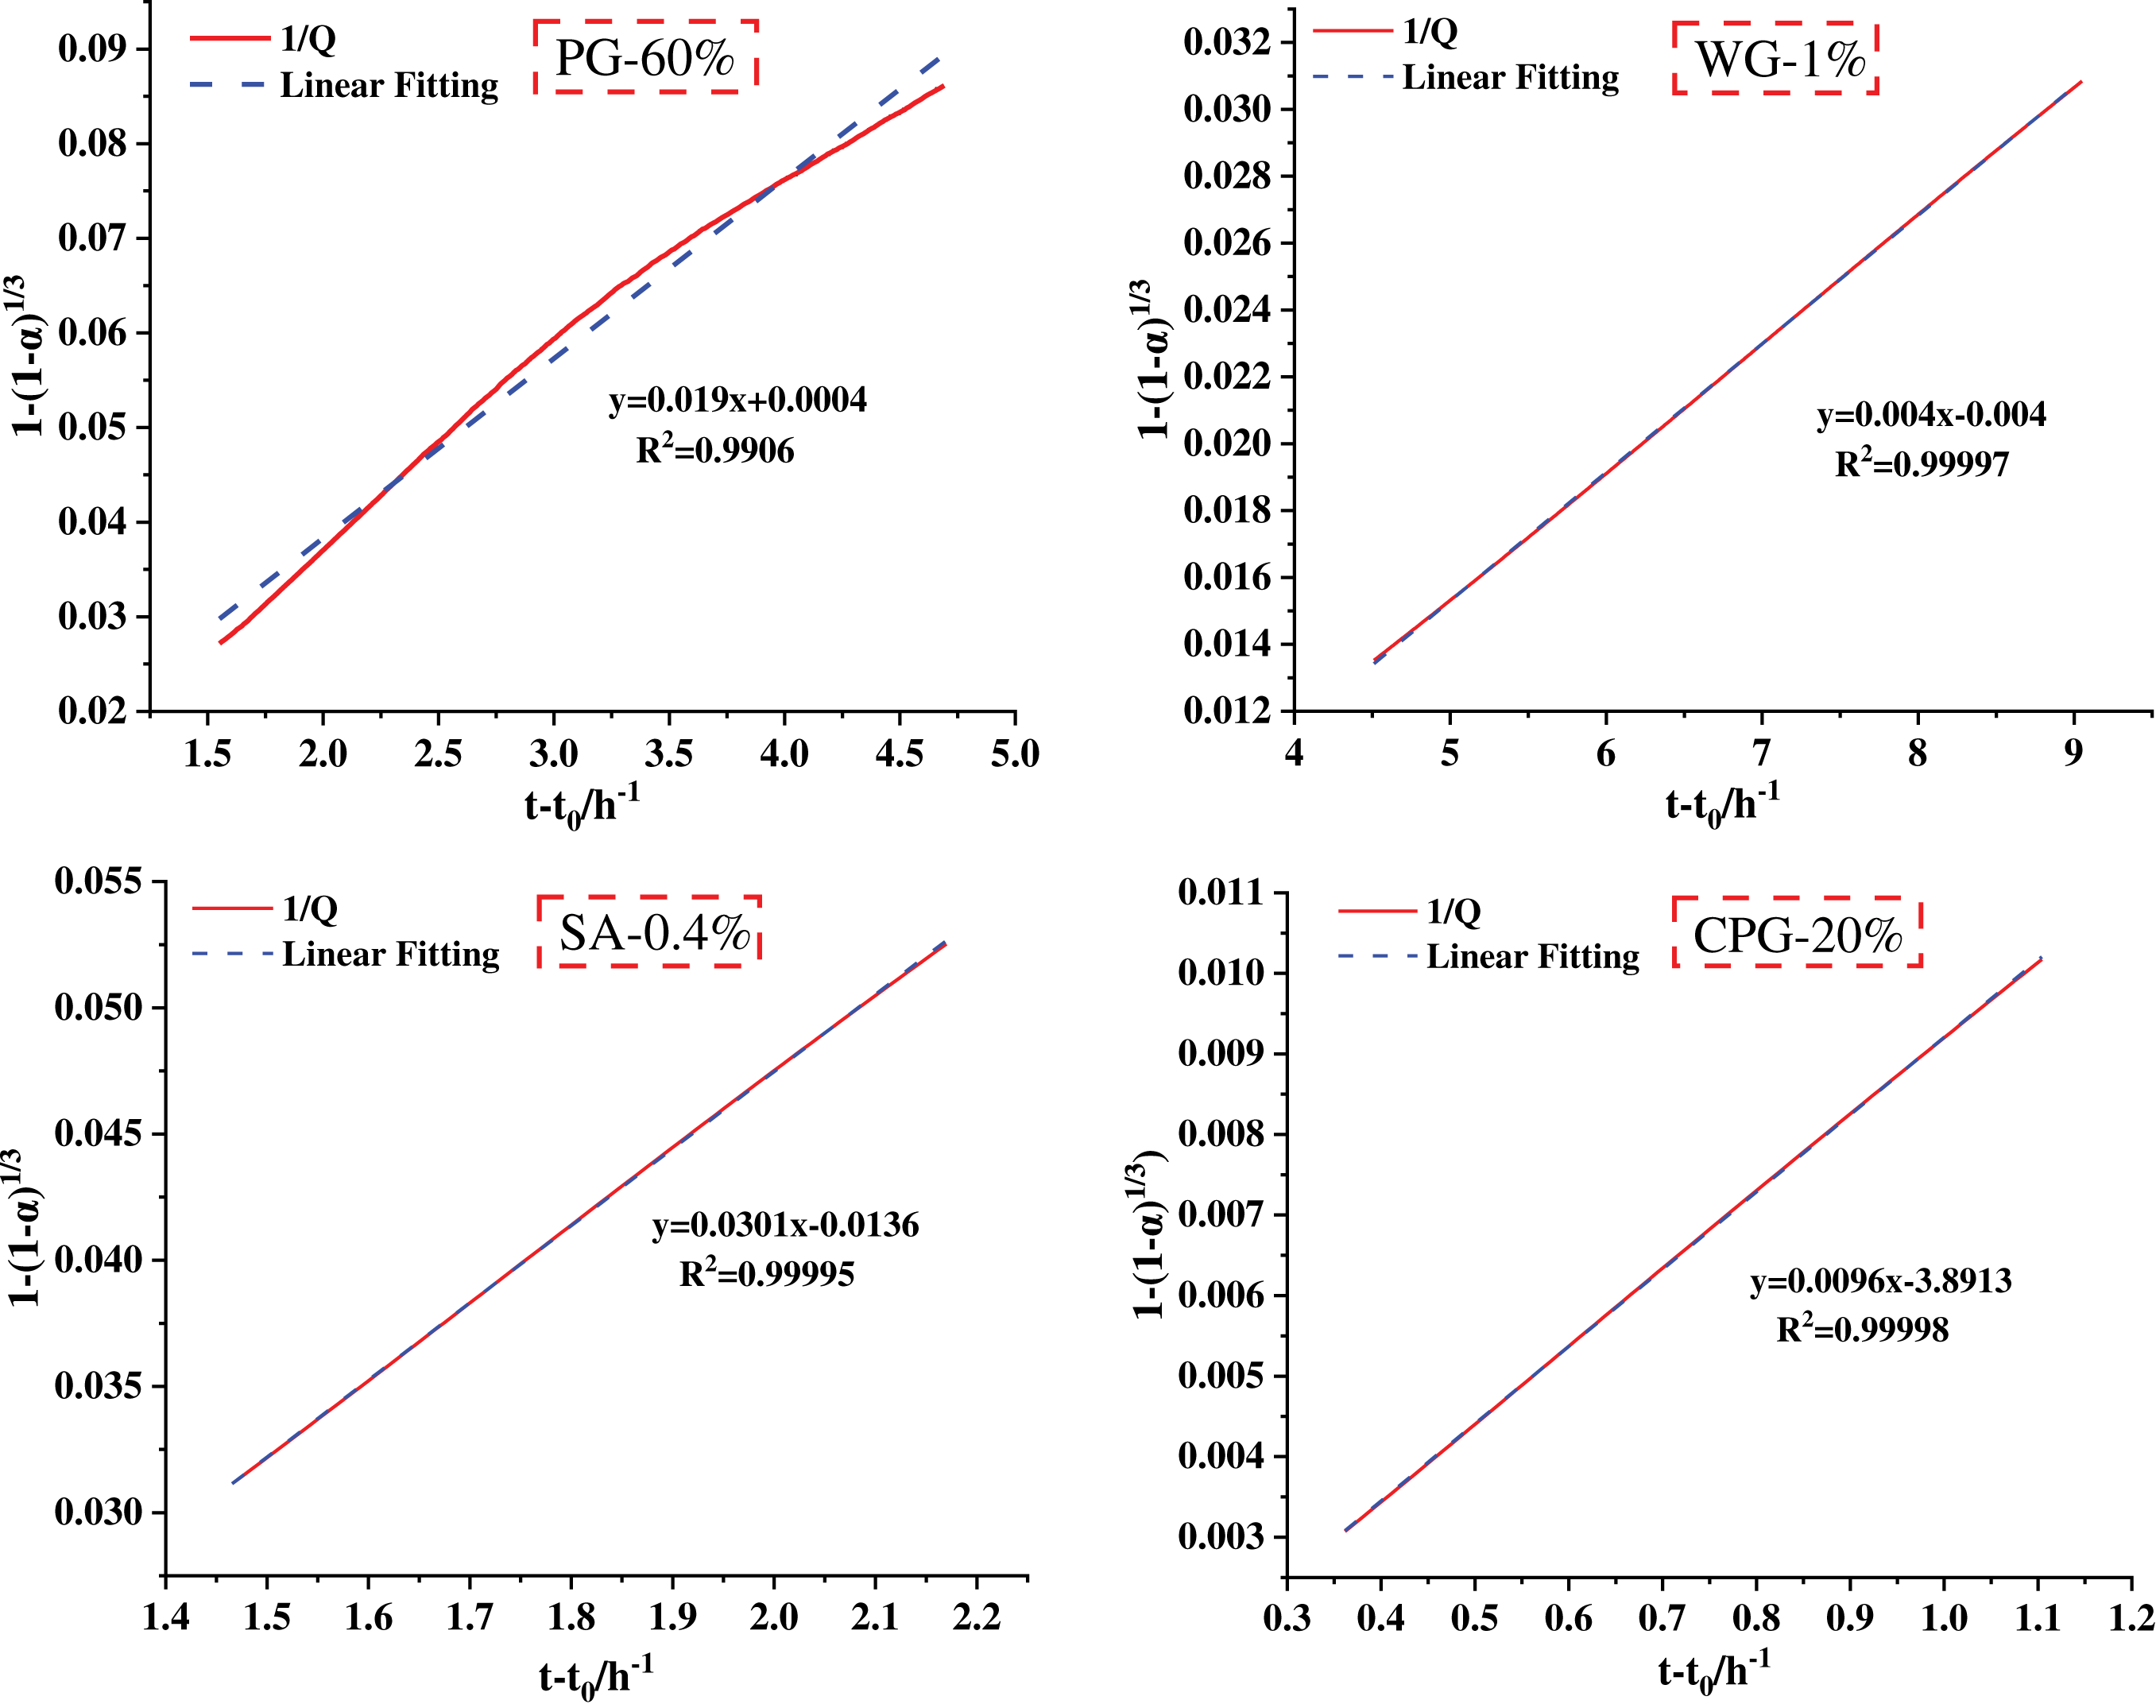
Figure 11 Linear fitting of the kinetic parameters for the I process
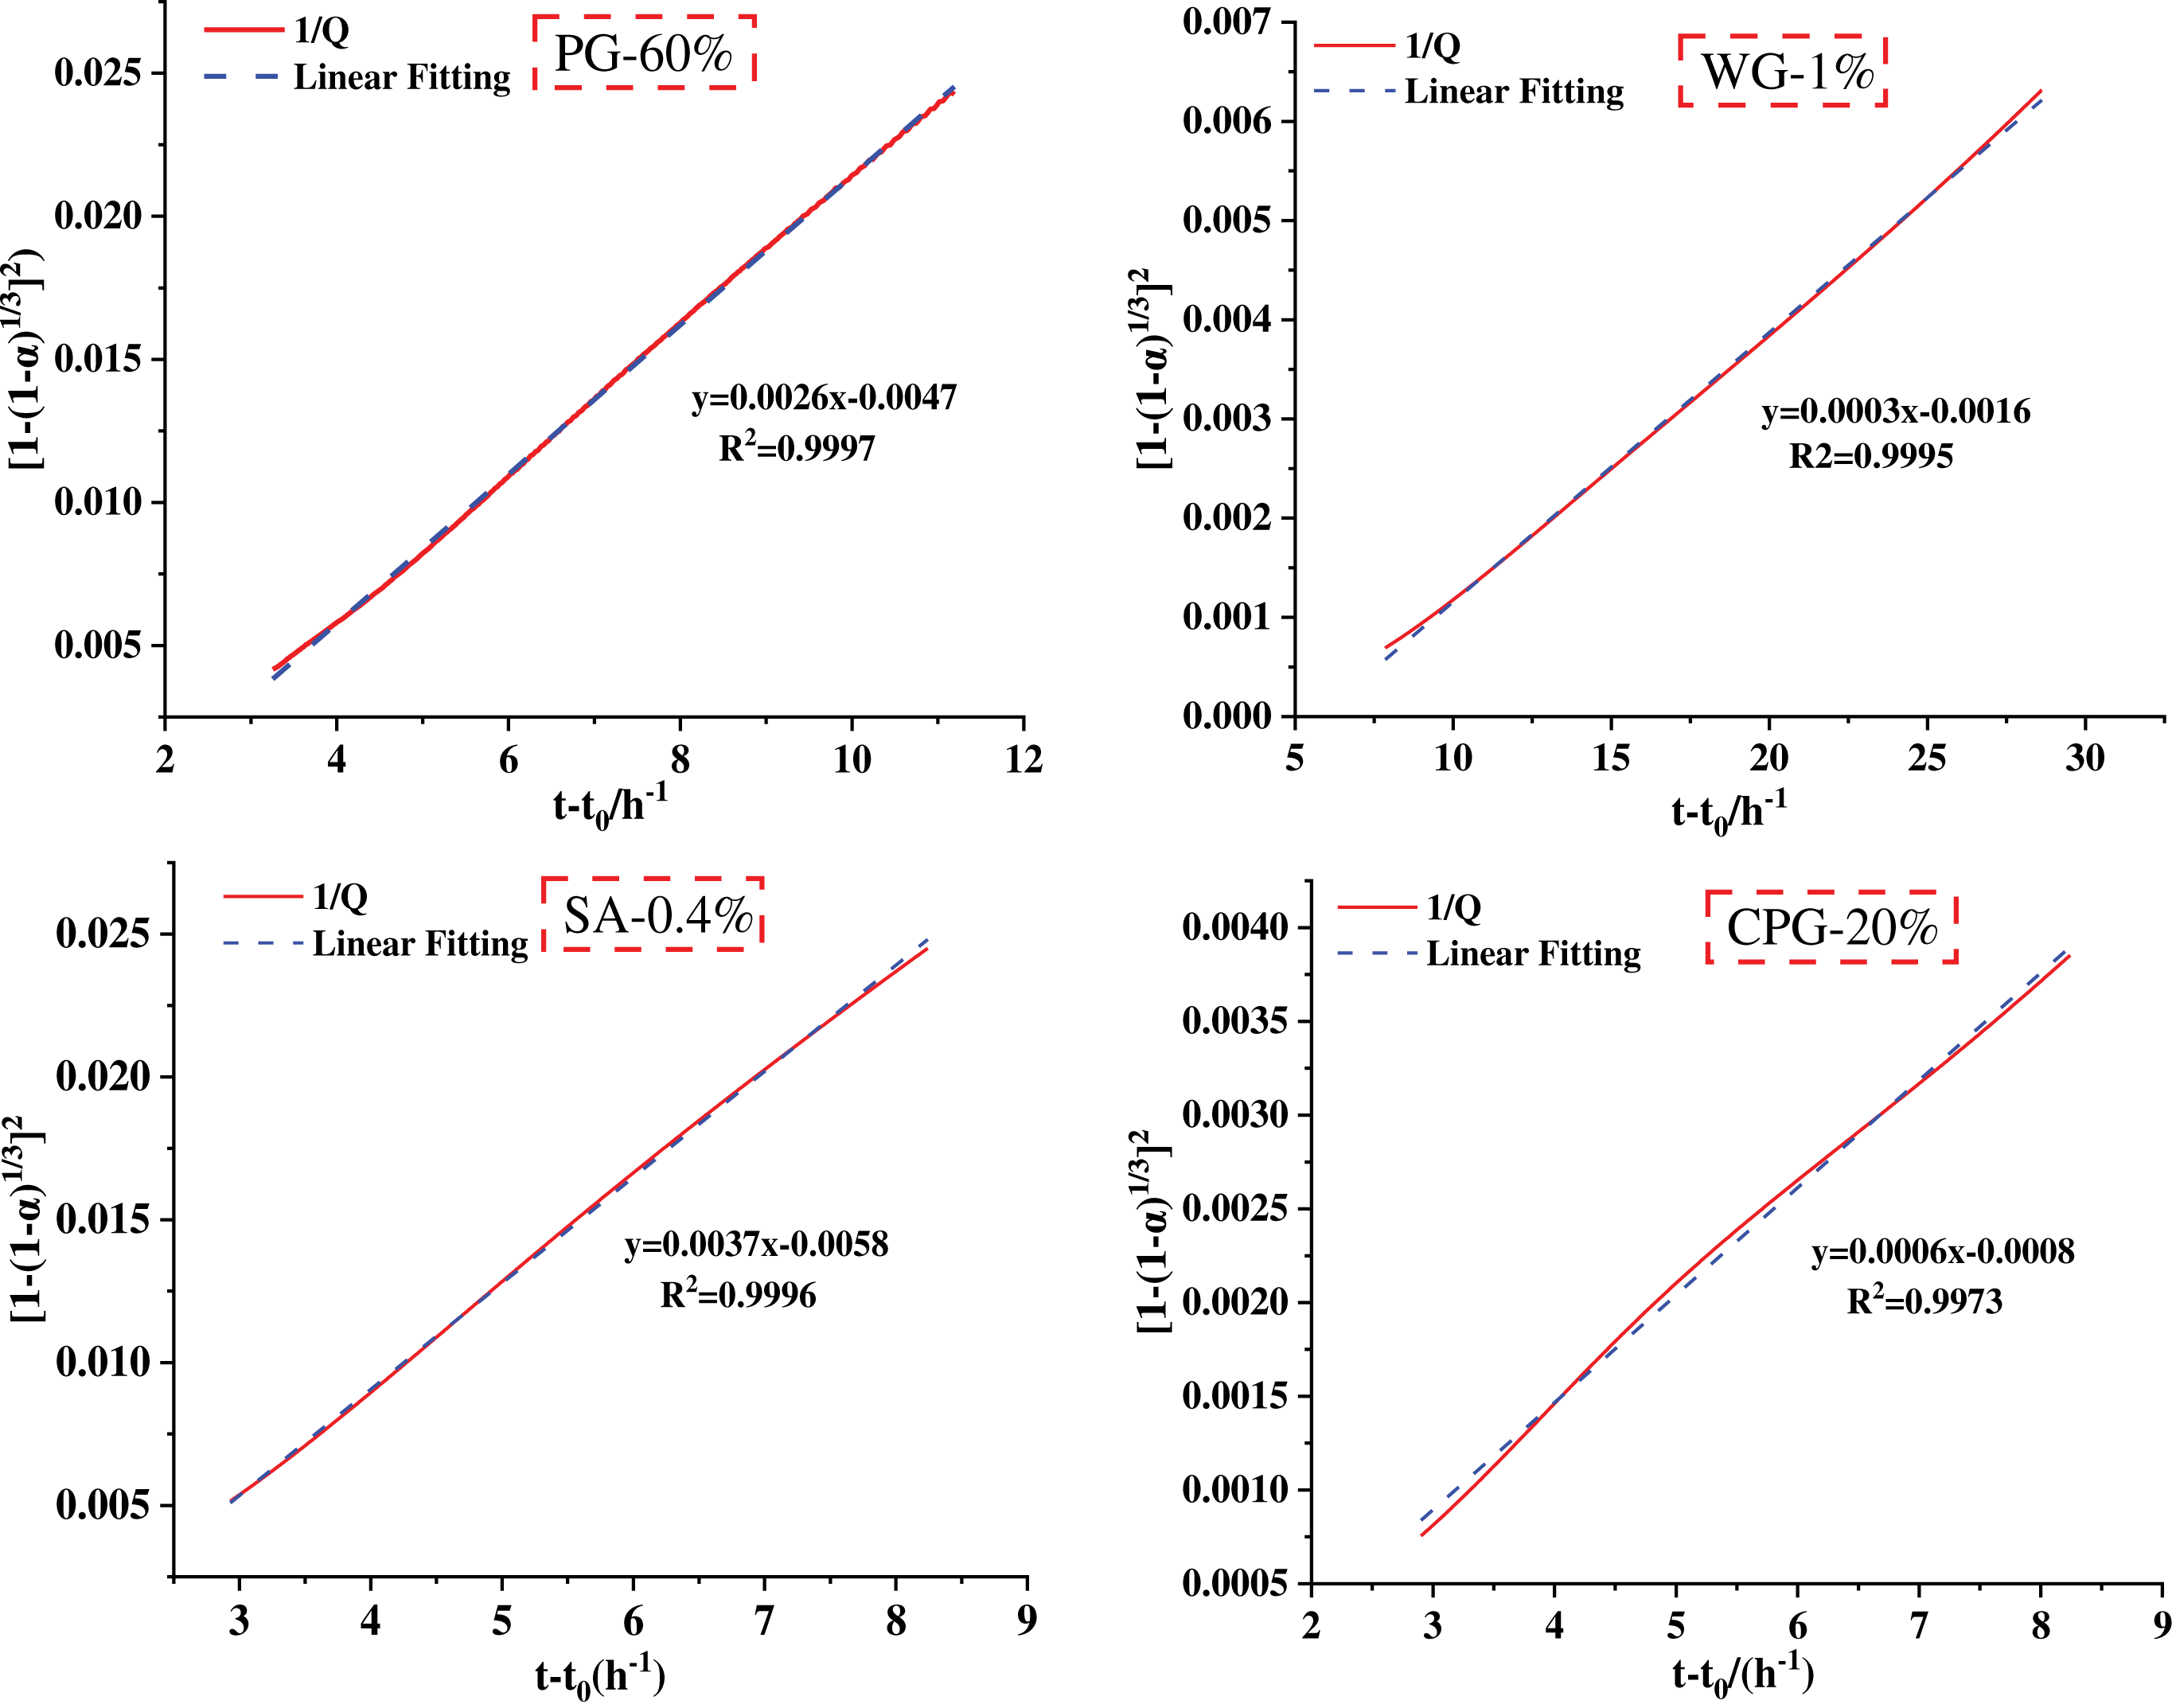
Figure 12 Linear fitting of the kinetic parameters of the process of solving D
Incorporating WG and CPG reduced total heat release. However, adding SA significantly increased total heat release and prolonged hydration time. The hydration processes of WG, SA, and CPG occurred simultaneously and influenced each other, as did the matrix. Fitting the hydration rate curves investigated the overall hydration characteristics and kinetics of the process. Using the Krstulovic-Dabic model, we obtained the actual hydration reaction rate curve (dα/dt) and the theoretical curves (F1(α), F2(α), and F3(α)) for the PFC paste, as shown in Figure 13, where F1(α), F2(α), and F3(α) represent the calculated hydration rates. α1 and α2 denote the transition points from the NG stage to the I stage and from the I stage to the D stage, respectively. This indicates different hydration mechanisms. For the PG-60%, SA-0.4%, and CPG-20% samples, α1 is smaller than α2, indicating that, after a period of hydration, the reaction process in stage I is longer, while the reaction process in stage NG is shorter. For WG-1%, however, α1 is larger than α2, suggesting that the reaction process in stage I is shorter, while the reaction process in stage NG is longer. These results demonstrate that the hydration reaction of PFC is a multiphase reaction mechanism rather than a single reaction.
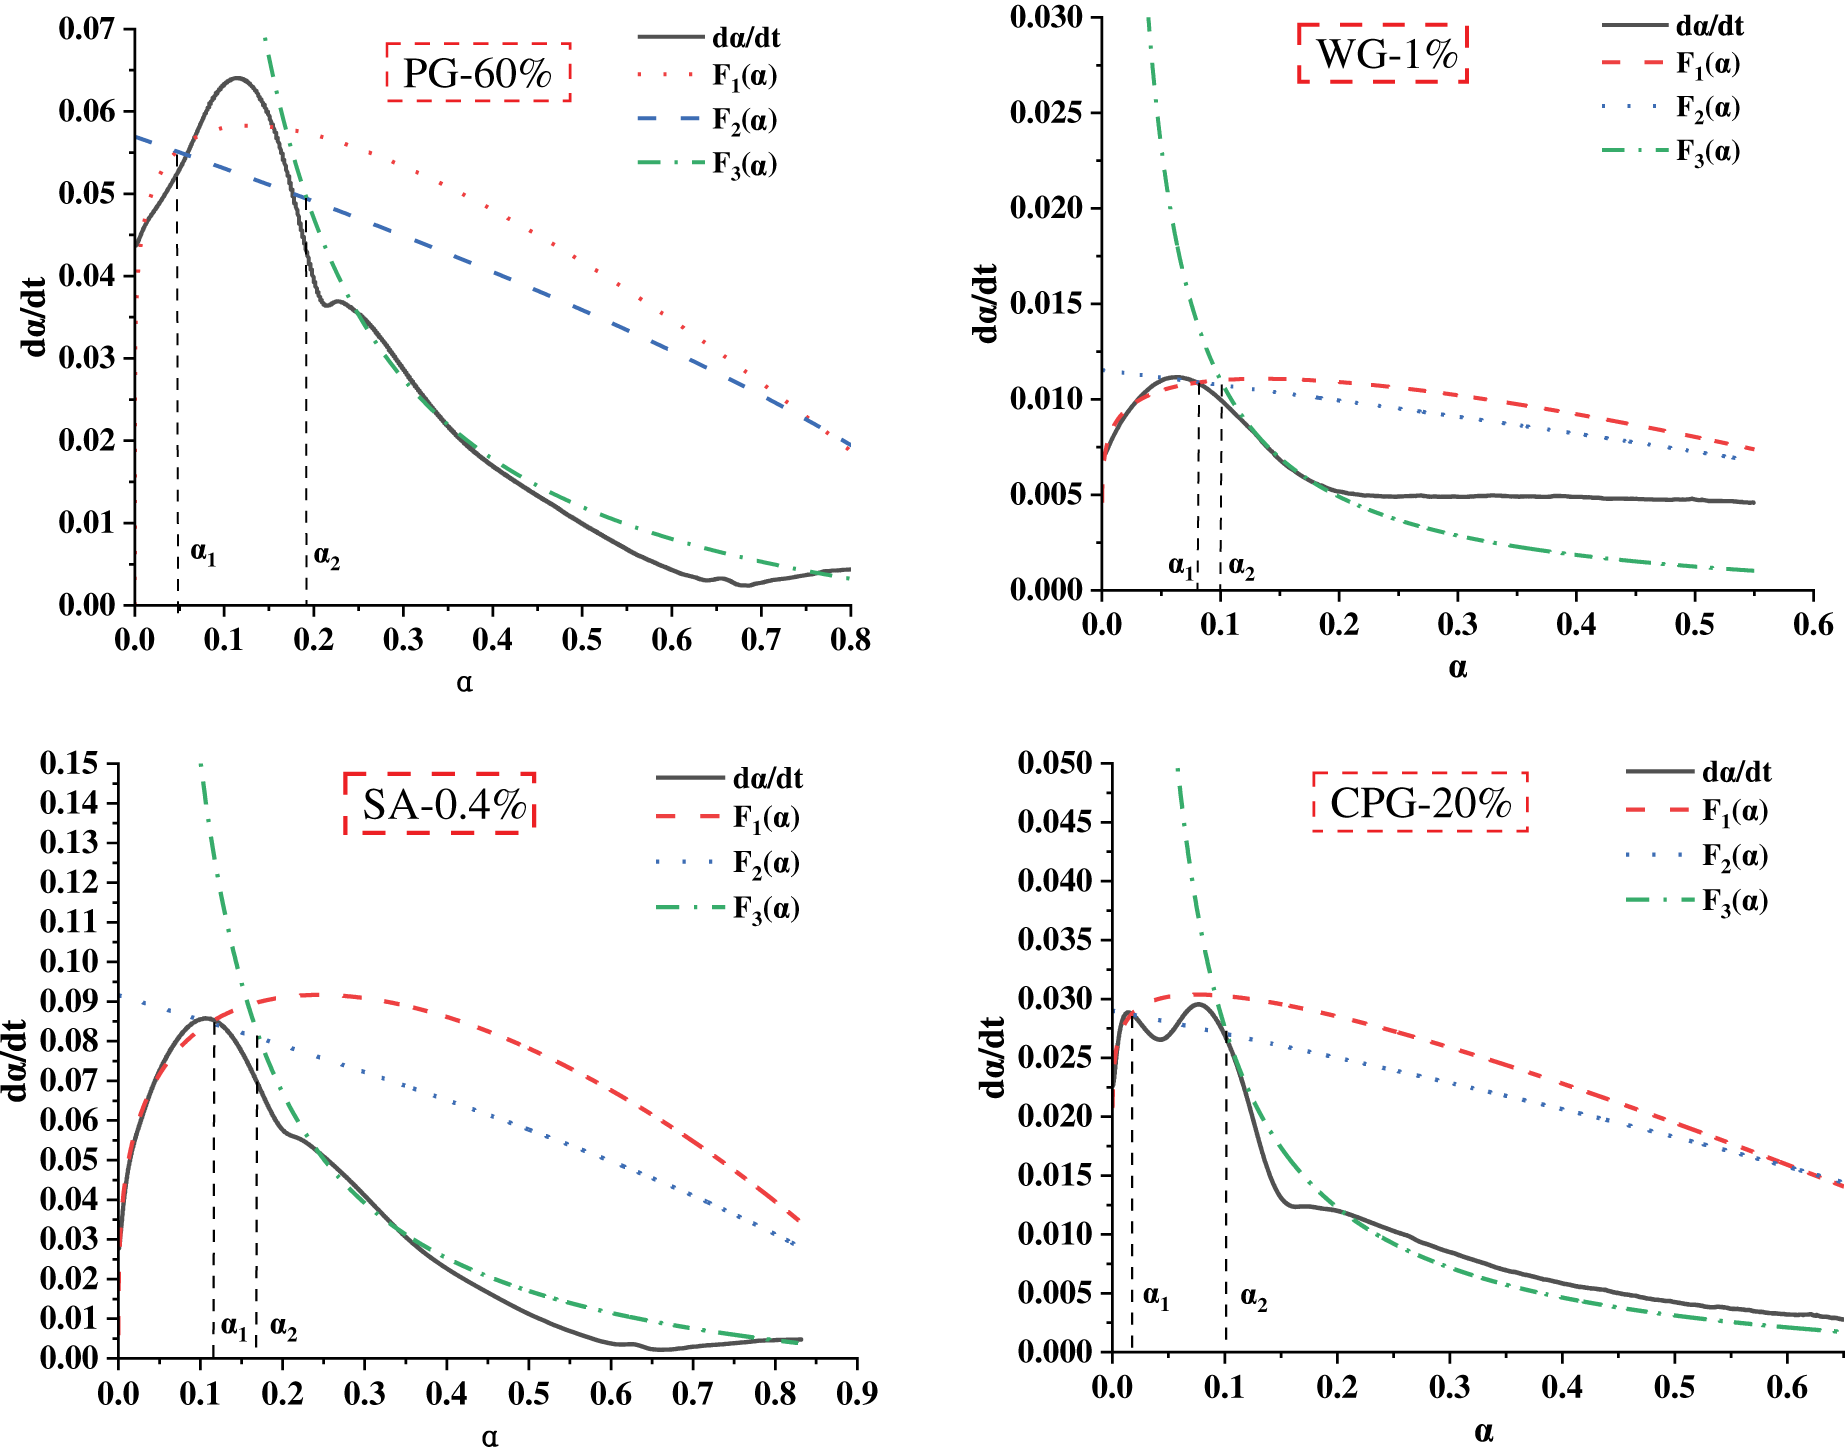
Figure 13 Hydration reaction rate curves of phosphogypsum foam concrete with different activators
Table 4 shows the kinetic parameters of the hydration process for phosphogypsum, slag powder, and cementitious matrix materials. As shown in the table, n represents the nucleation and growth characteristics of the hydration products. K1′ is approximately four to five times greater than K2′ and thirty times greater than K3′, indicating that the NG process’s chemical reaction rate is significantly higher than the I and D processes’. This is primarily because the NG process is a nucleation-controlled autocatalytic reaction that leads to the rapid growth of hydration products. Before the hydration products interpenetrate, growth of the crystal nuclei increases the specific surface area of the hydration product phase. This, in turn, promotes the hydration reaction. However, the reaction rate at phase boundaries is influenced by multiple factors, such as ion concentration in the solution, crystal specific surface area, and growth space for hydration products. As the hydration process progresses, the pH of the pore solution increases, leading to OH− induced decomposition of the slag powder glass phase. This triggers pozzolanic reactions during process I, significantly affecting the reaction rate of process I [47].

As the reaction enters the D process, the spatial barrier effect of the hydration products increases significantly. On the one hand, the C-S-H gel layer envelops the hydration particles, reducing the permeability of water molecules into the interior of the cementitious material. On the other hand, the diffusion resistance of Ca2+ and OH− approaching the particles of unreacted slag powder greatly increases. This dual-barrier effect leads to a significant decrease in the D process reaction rate. During the NG stage, adding WG-1% and CPG-20% reduces the reaction order, n, and K1′, indicating that both agents weaken C-S-H gel nucleation and growth. SA-0.4% exhibits the highest values for n and K′. This is because SA releases partial heat upon incorporation into the paste, which accelerates cementitious dissolution during the initial NG stage of hydration. This promotes supersaturation of the C-S-H gel and AFt in the system, facilitating nucleation and accelerating crystal growth. The quantitative analysis of the hydration product was conducted previously [48], which showed that the increase in compressive strength is attributed to the increasing amount of hydration products.
The T2 value, which represents the mobility of water molecules, is affected by the presence of pores, which constrain their freedom of movement. Typically, a higher T2 value indicates larger pore sizes, and a greater number of pores of that size is indicated by a higher value on the vertical axis.
To quantify the microporosity of PFC, the Carr–Purcell–Meiboom–Gill (CPMG) echo decay curve method was used to invert the T2 spectrum [49]. Figure 14 shows the pore size distribution data obtained from NMR testing of PFC. As shown, PFC exhibits a bimodal pore size distribution, whereas PFC with added activators displays a trimodal distribution. The respective pore size distributions are 0.44–41.41 μm, 0.05–93.09 μm, 0.028–44.91 μm, and 0.03–41.41 μm. Additionally, we used the most probable pore size to characterize the pore sizes of the four sample groups. The maximum pore size was in the micrometer range. Compared to PG-60%, WG-1% increased the maximum pore size by 34.3%; SA-0.4% decreased it by 4.7%; and CPG-20% increased it by 0.67%. The pore volume distribution is shown in Figure 15. As can be seen, incorporating activators reduces pore volume compared to PG-60%. This is primarily because activator incorporation promotes hydration reactions, in which the generated hydration products squeeze or fill micropores and subsequently separate into smaller transition pores [48, 50].
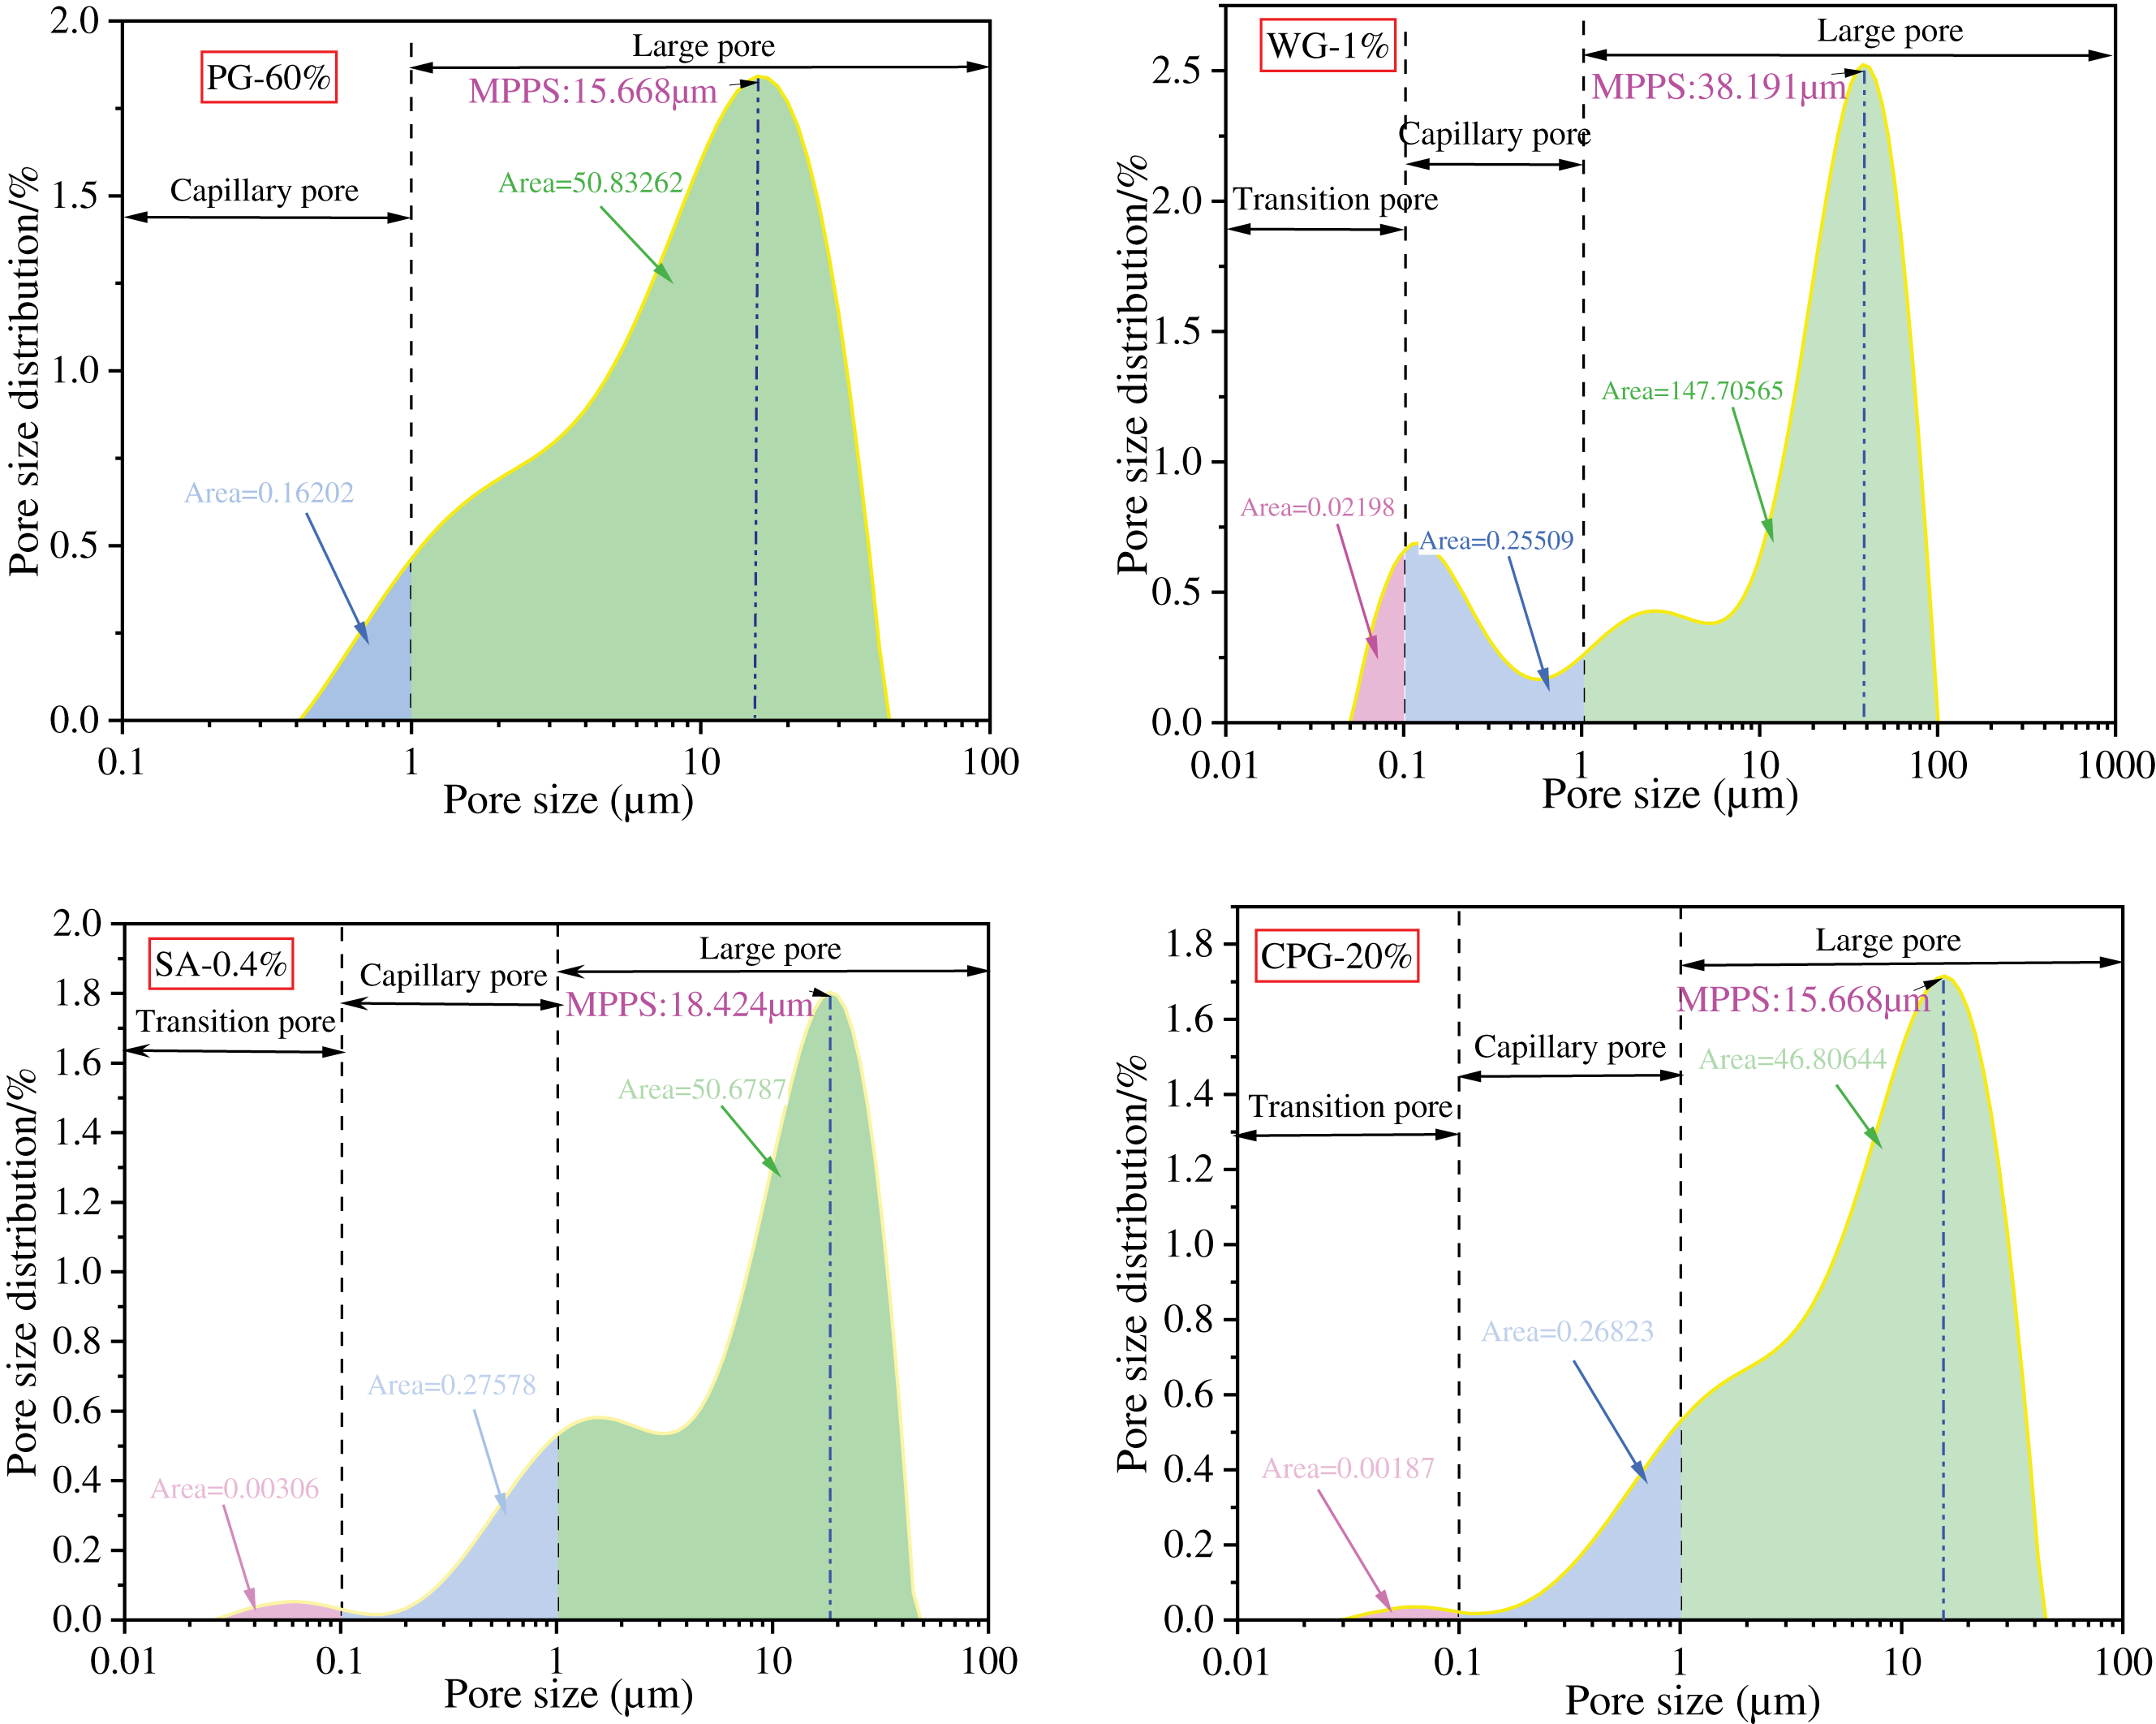
Figure 14 Pore size distribution of PG-60%, WG-1%, SA-0.4%, and CPG-20%
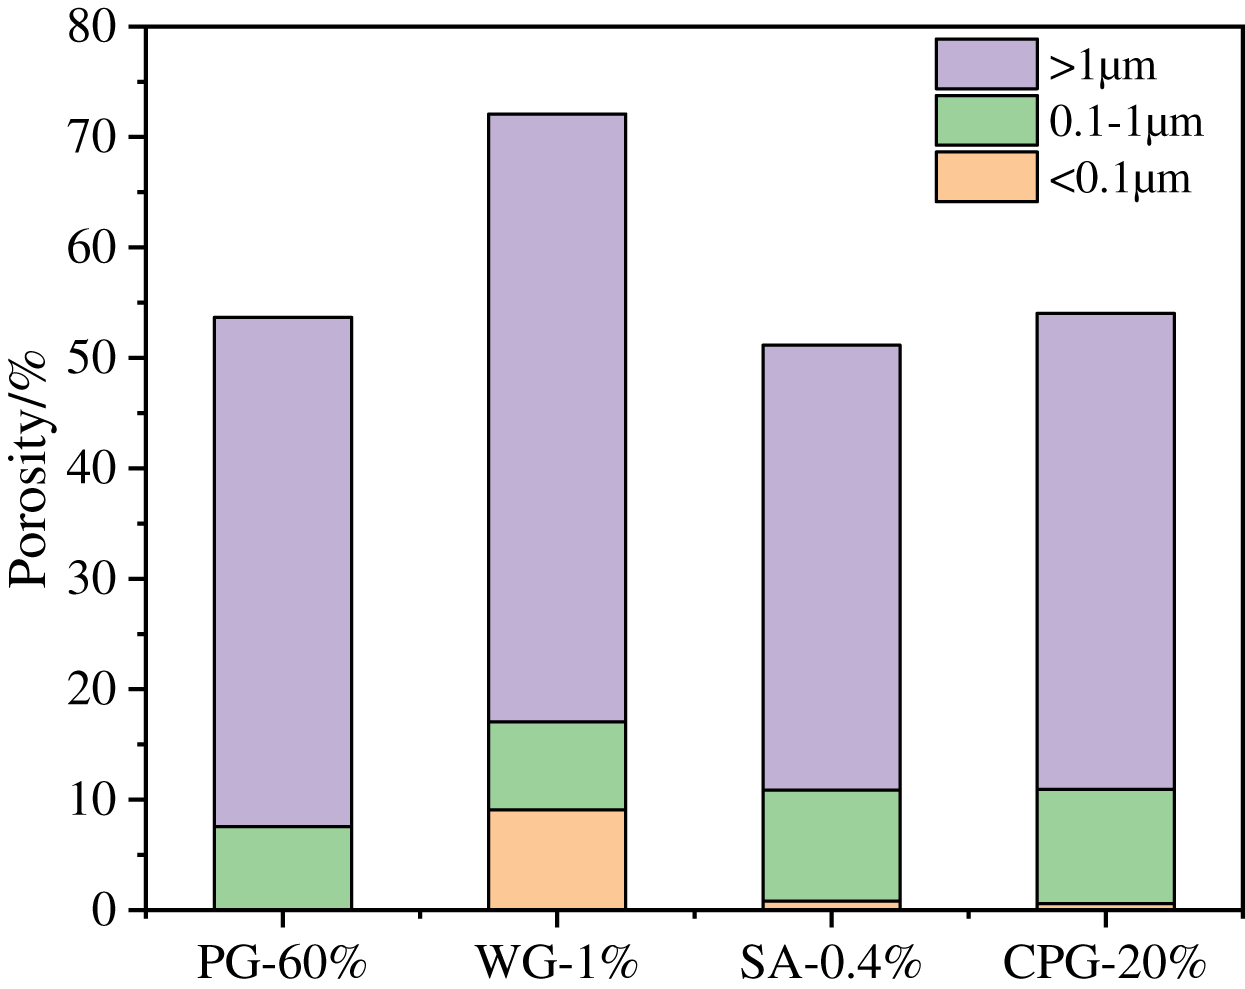
Figure 15 Porosity of specimen and percentage of pores
To clarify the response of PFC pore characteristics to different activators, pores were classified into four categories based on their diameters: gel pores (0.001–0.01 μm), transition pores (0.01–0.1 μm), capillary pores (0.1–1 μm), and macropores (>1 μm) [51]. The total area of each pore category was quantified to analyze their distribution patterns. The control group (PG-60%) only contained capillary pores and macropores, whereas the activator-added groups (WG-1%, SA-0.4%, and CPG-20%) exhibited additional transition pores. This difference is mainly attributed to the activation effect of the additives—activators promote the participation of latent active components in PG and GGBFS in hydration reactions, leading to the formation of a large amount of ettringite (AFt). The AFt fills the original pores and induces the formation of numerous small transition pores, thereby reconstructing the internal pore structure of PFC. A comparison of the integrated areas of the macropores in the aforementioned samples reveals that the macropore areas significantly exceed those of the other pores, measuring 362.49, 50.84, 147.71, 50.68, and 46.82, respectively. These results clearly demonstrate that introducing artificial bubbles significantly impacts foam concrete. SA and CPG promote the formation of small pores, thereby reducing the proportion of large pores.
Figure 16 shows the T2 spectrum of phosphogypsum foam concrete that was cured for 28 days. As can be seen, the T2 spectrum of the phosphogypsum control group exhibits one main peak accompanied by one secondary peak. In contrast, the T2 spectra of the specimens that incorporated the three activators (WG, SA, and CPG) are similar. Each of these spectra displays one main peak and two secondary peaks. To analyze the influence of pore structure on PFC further, fractal geometry was employed to quantitatively analyze and compare the pore structures. According to fractal theory, pores in porous materials exhibit distinct fractal characteristics in terms of pore volume, pore area, and pore size distribution. When characterizing the microscopic pore structure of concrete using fractal theory, the fractal dimension can describe the complexity of pore morphology and spatial distribution [52]. A higher fractal dimension indicates greater complexity in the morphology and spatial distribution of concrete pores. Tang et al. [53] and Gao et al. [54] found that the fractal dimension bridges the microscopic structure and macroscopic properties of concrete, serving as a quantitative indicator for material design. During cement hydration, the filling of pores by hydration products can be regarded as a fractal phenomenon [55]. According to fractal theory, the pore volume of porous materials follows a power-law relationship with pore diameter (V∝d3−D). it can be represented as follows [51, 56]:
where Sv is the percentage of the total pore volume occupied by pores with diameter less than d, Vd is the cumulative volume of pores with diameter less than d, and Vs is the total volume of all pores. dmin and dmax denote the minimum and maximum pore sizes, respectively. D is the NMR fractal dimension. In the LF-NMR test, the T2 relaxation time of water molecules is linearly related to the pore diameter (d) where they reside. Therefore, Sv can be redefined as follows:
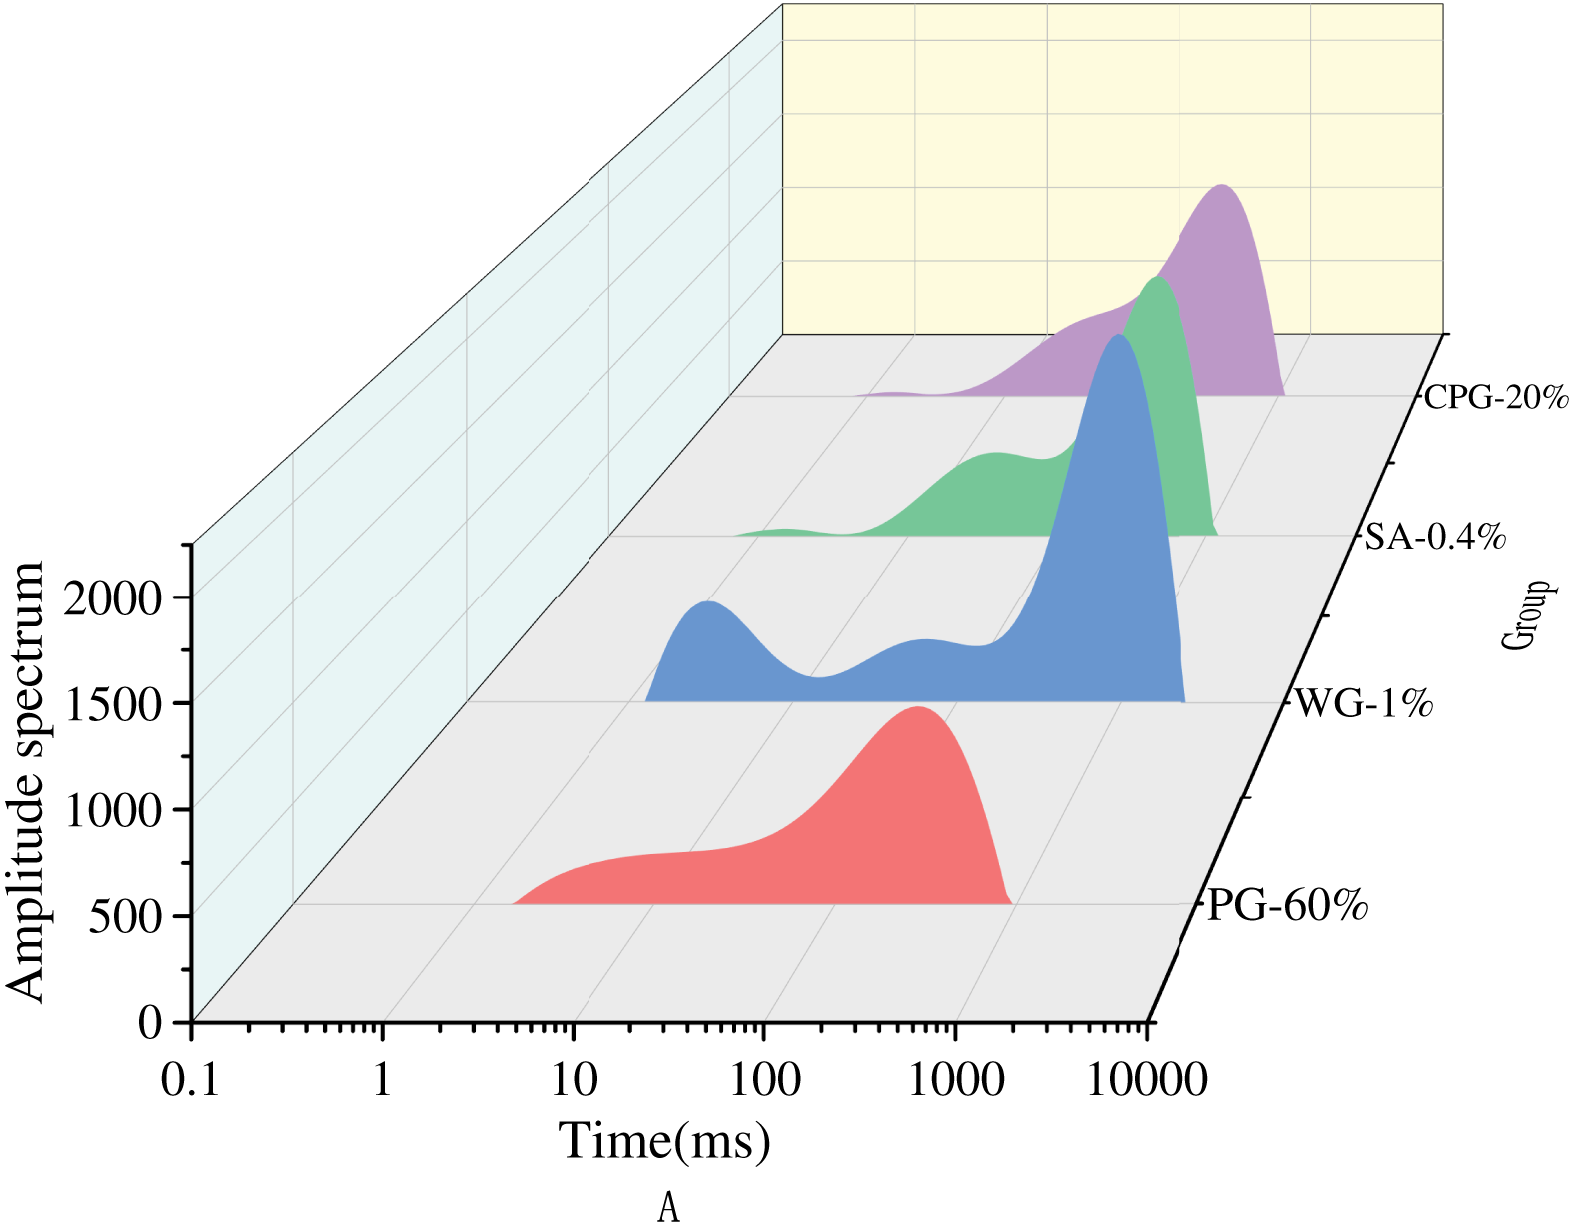
Figure 16 T2 relaxation signal of specimens maintained for 28 d
Take the logarithm of both sides of Equation (12):
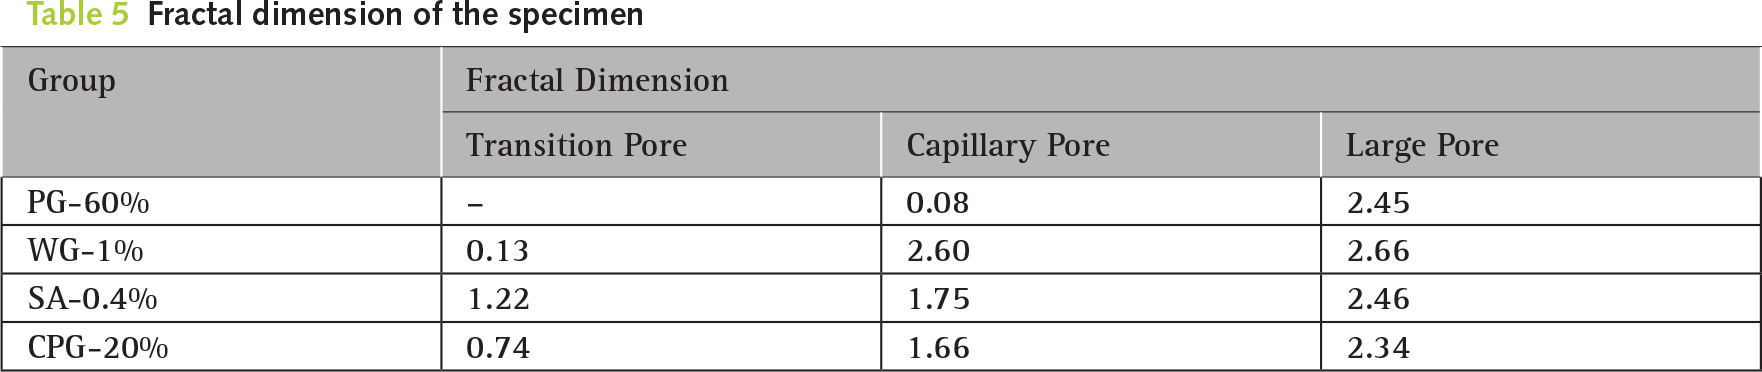
where T2 is the relaxation time; T2max is the maximum relaxation time. It can be observed that for a given transverse relaxation time (T2) of water molecules, there exists a logarithmic linear relationship between T2 and Sv (the total volume of pores occupied by water molecules with relaxation time less than this T2), and the linear coefficient is 3 − D. The fractal dimension (D) which characterizes the fracture behavior of pore structure can be calculated by linear fitting of the lgT2-lgSv curve [57]. For, cementitious materials, when D = 2, the pore surface approaches smoothness. When D = 3, the pore structure becomes uneven, rough, and complex [58, 59]. Fractal characteristics emerge when 2 < D < 3, and neither fractal nor non-fractal characteristics are present when D < 2 or D > 3 [60]. Figure 17 shows the relationship curve between lgT2 and lgSv. The relaxation times of transition pores, capillary pores, and air-voids are calculated. The fractal dimension values are listed in Table 5. The fractal dimensions of transitional pores are all less than 2, indicating that they lack fractal characteristics. The fractal dimensions of the PG-0%, PG-60%, CPG-20%, and SA-0.4% capillary pores were also less than 2 and lacked fractal characteristics. However, the fractal dimension of the WG-1% pore was 2.60, exhibiting complex fractal characteristics and a rough pore surface. Macropores exhibit fractal dimensions between 2 and 3, satisfying fractal criteria. PG-60% has a dimension of 2.66, indicating complex, rough pore structures. CPG-20%, on the other hand, has a dimension of 2.34, suggesting relatively smooth pore surfaces. These results demonstrate that the pore structure of PFC is complex and diverse. Incorporating WG further complicates the capillary pore structure of PFC, indicating that complex pore structures influence performance. It should be noted that the linear correlation of some data is relatively poor. The main reason is the scale-dependent nature of the pore fractal characteristics, which are only applicable to specific pore size ranges. Transition pores may be composed of capillary pores and irregular pores, lacking a unified morphological pattern, thus failing to comply with the core assumption of fractal theory [61].
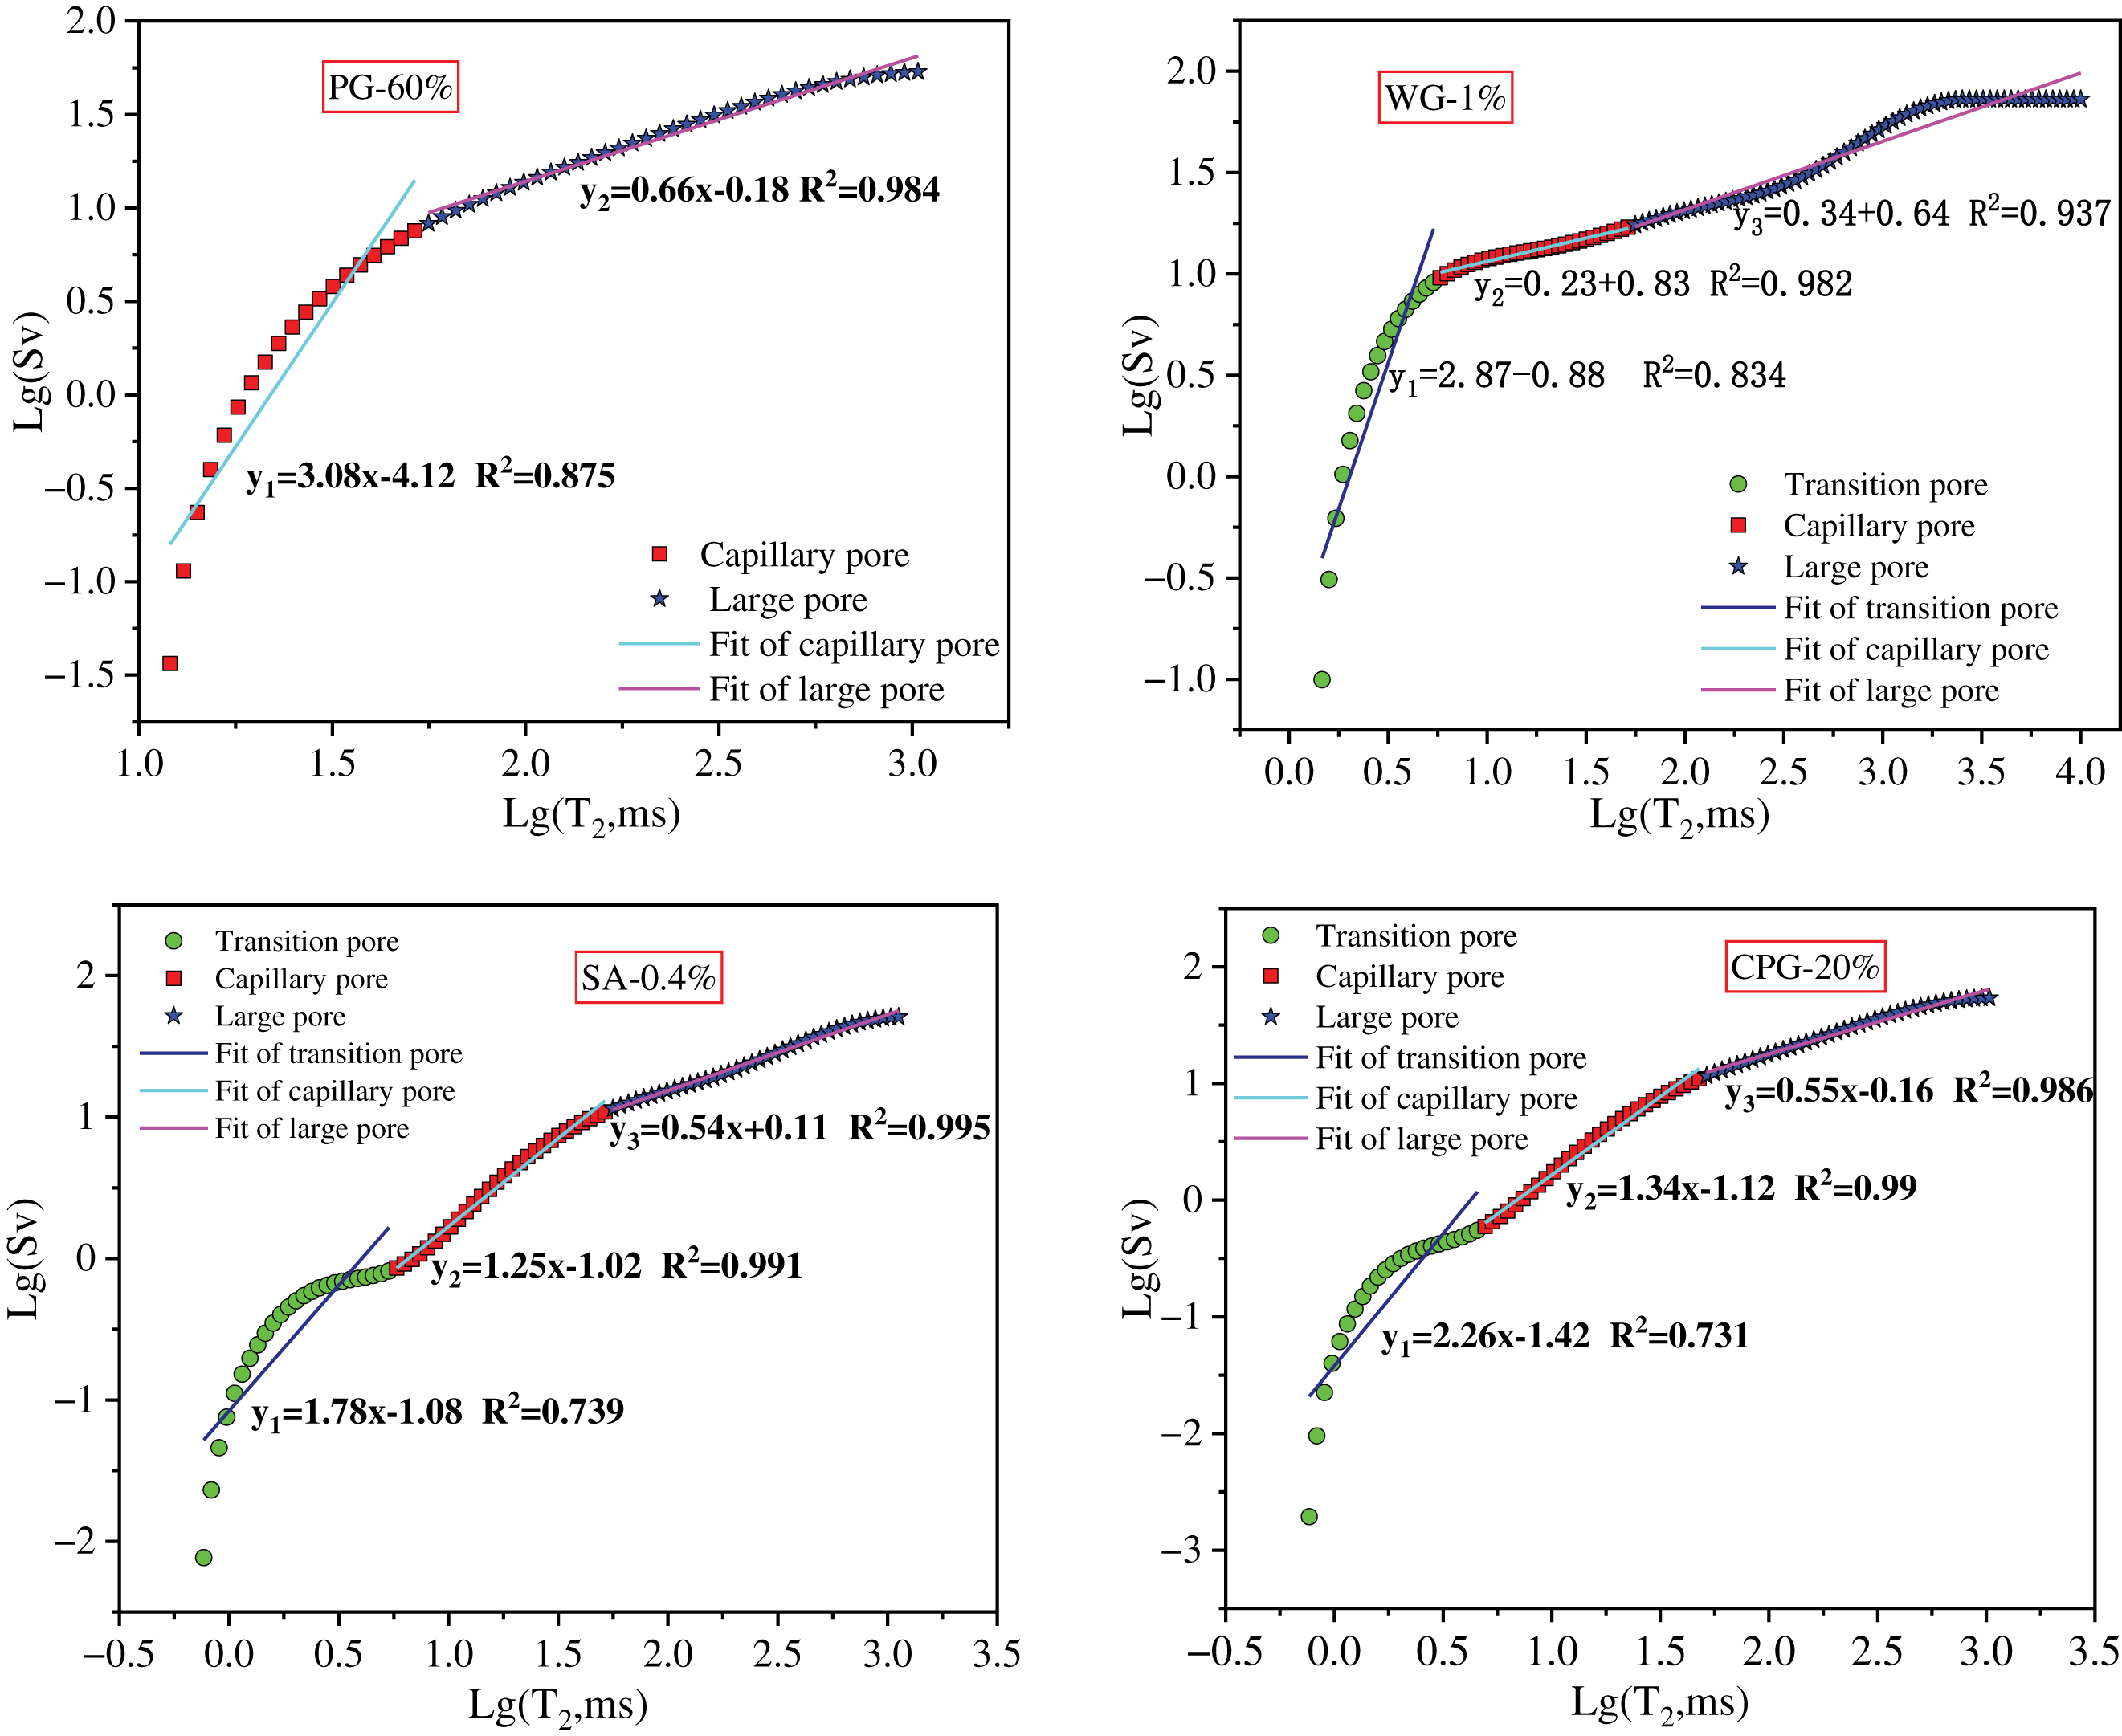
Figure 17 Fractal dimension fitting curves of specimen pores
This study examined the preparation of PFC using mixed alkali-activated materials. The effects of different activators on the workability, mechanical properties, and hydration process of PFC were investigated. LF-NMR were employed to analyze its pore structure. The following conclusions can be drawn:
(1) The three activators all contribute to the improvement of PFC’s compressive strength, while the fluidity of the mixture decreases with the increase of activator dosage. The optimal dosages were determined to be 1% addition for waterglass, 0.4% addition for sodium aluminate (by mass), or 20% replacement for calcined phosphogypsum. At these optimal dosages, the 28 d compressive strength of PFC was 1.12 MPa, 1.56 MPa, and 1.30 MPa, with corresponding fluidity values of 193 mm, 180 mm, and 190 mm, respectively.
(2) Incorporating water glass and calcined phosphogypsum reduces the reaction rate and total heat release of PFC. According to calculations based on the Krstulovic-Dabic model, both the reaction order (n) and the apparent reaction rate (K′) decrease. However, the addition of sodium aluminate increases the reaction rate and total heat release of PFC. The reaction order (n) and apparent reaction rate (K′) both increase, indicating that sodium aluminate accelerates the nucleation and growth of the C-S-H gel.
(3) The activator increases transition pores, and partially fills macropores. These processes enable the formation of a dense layer and improved strength. Using T2 spectra, the fractal dimension of pores during hydration was calculated based on fractal theory. This calculation indicates that the fractal characteristics in the samples do not cover all pores. Macropores in all four test groups exhibited fractal characteristics. However, water glass altered bubble stability, inducing fractal properties in capillaries and making pores complex and rough. These results suggest that intricate pore structures influence pore performance.
This study focuses only on the hydration kinetics and pore structure of foamed concrete. For the transition from laboratory research to engineering application, further data on durability and dimensional stability are still required.
Acknowledgement
Not applicable.
Funding Statement
Financial support from the Science and Technology Project of Anhui Transportation Holding Group Co., Ltd. (JKKJ-2022-09), Natural Science Foundation of Anhui Province (2408085J027), Ecological Environment Scientific Research Project of Anhui Province (2023hb0014) and State Key Laboratory of High Performance Civil Engineering Materials (2022CEM013) is gratefully acknowledged.
Author Contributions
The authors confirm contribution to the paper as follows: Conceptualization, Gaozhan Zhang; investigation, Zhifeng Zhang and Leilei Wu; writing—original draft preparation, Zhifeng Zhang; writing—review and editing, Gaozhan Zhang; visualization, Dahai Yang and Jun Yang; supervision, Ming Li; project administration, Gaozhan Zhang. All authors reviewed and approved the final version of the manuscript.
Availability of Data and Materials
Data available on request from the authors.
Ethics Approval
Not applicable.
Conflicts of Interest
The authors declare no conflicts of interest.
Abbreviations
The following abbreviations are used in this manuscript
| OPC | Ordinary Portland cement |
| SAC | Sulphoaluminate cement |
| FA | Fly ash |
| PG | Phosphogypsum |
| CPG | Calcined phosphogypsum |
| PFC | Phosphogypsum foam concrete |
| WG | Water glass |
| SA | Sodium aluminate |
| AAM | Alkali-activated material |
| FTIR | Fourier transform infrared spectroscopic |
| LF-NMR | Low-field nuclear magnetic resonance |