

Latest trends for CCUS in the cement industry

First CCS system at the Brevik cement plant
Summary
Carbon capture, utilisation and storage (CCUS) is seen as an essential breakthrough technology for achieving a net-zero (or carbon neutral) cement and concrete production by 2050. But this is controversial because of the high costs of such systems and as well as the entrance barriers. In this article, the latest trends for CCUS systems in the cement industry are reviewed. Will CCUS dominate cement industry decarbonisation?
To keep global warming in 2050 below 1.5°C compared to 1990, less than 235 Gt of CO2 accumulated emissions are allowed from now on, corresponding to 9.4 Gt of CO2 per year [1]. Today, the global cement industry alone emits 2.5 Gt (2.5 bn t) of CO2 per year [2]. According to roadmaps by the cement industry, these specific CO2 emissions can be decreased to zero with the right measures. Up to 50% or even more of the CO2 reduction should be achieved by carbon capture, utilisation and storage (CCUS) systems. However, the operation of a cement plant changes if a large-scale capture system is installed, while the CO2 transportation and storage costs (downstream system) can be as high as the capture costs. CCUS will only achieve a return of investment, if CO2 permit prices increase to more than 350€/t. Furthermore, industrial-scale CCUS projects are complex and take 10 years or more for implementation. This requires capabilities which the cement industry needs to outsource.
In 2025 OneStone Consulting published a market report about the available CCUS technologies and the costs for carbon capture and downstream utilisation and storage systems [3]. One section of the report covered an analysis of the industrial-scale CCUS projects with capture capacities above 0.2 annual tons per year (Mta). Figure 1a,b shows the results. Globally, 46 projects were identified, of which 19 are substantially funded. The EU Innovation fund alone was responsible for funds of €2 bn last year. 32 projects are in the EU, 3 projects in other European countries and 6 in North America. From the published information at that time, three technologies dominate the market: Oxyfuel, cryogenic and solvent technologies. Figure 2 shows an example of the information provided be Holcim on its CCUS projects [4], Figure 3 is a similar example of information provided by Heidelberg Materials [5]. These two companies are far ahead of all other cement producers regarding the number of CCUS projects in hand.
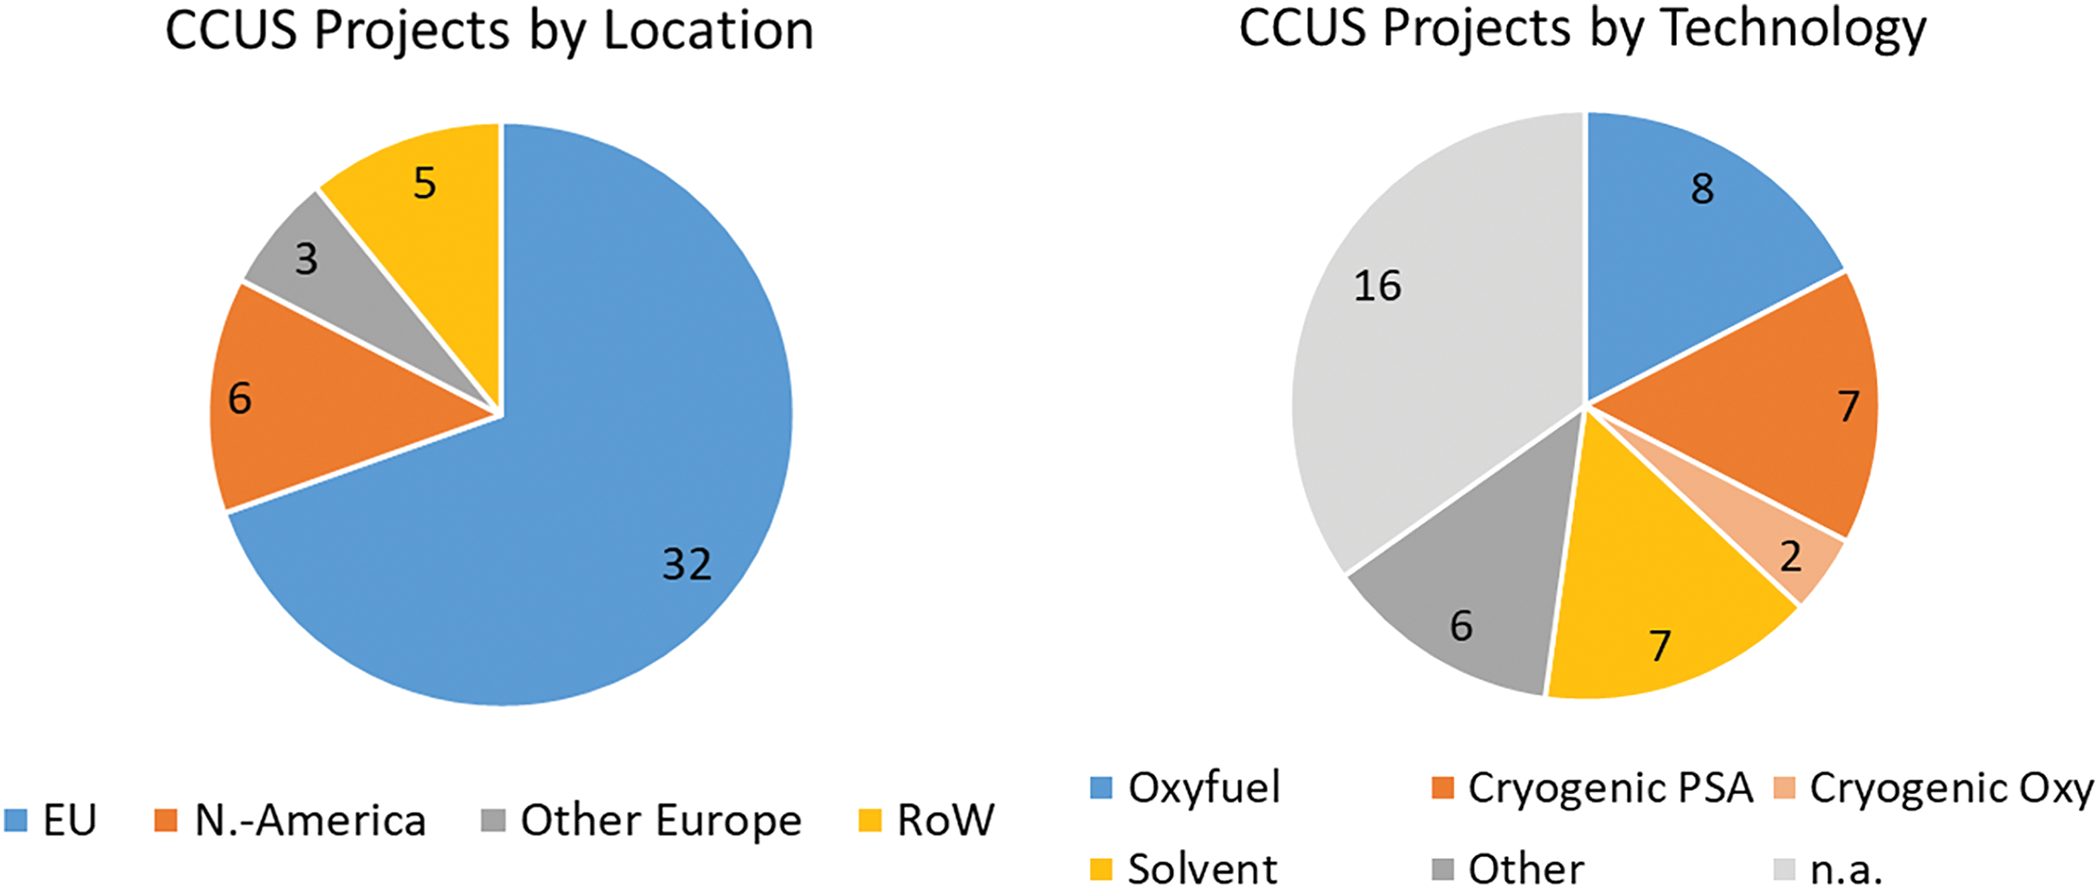
Figure 1 a/b: Overview CCUS projects 2025 (OneStone Consulting)
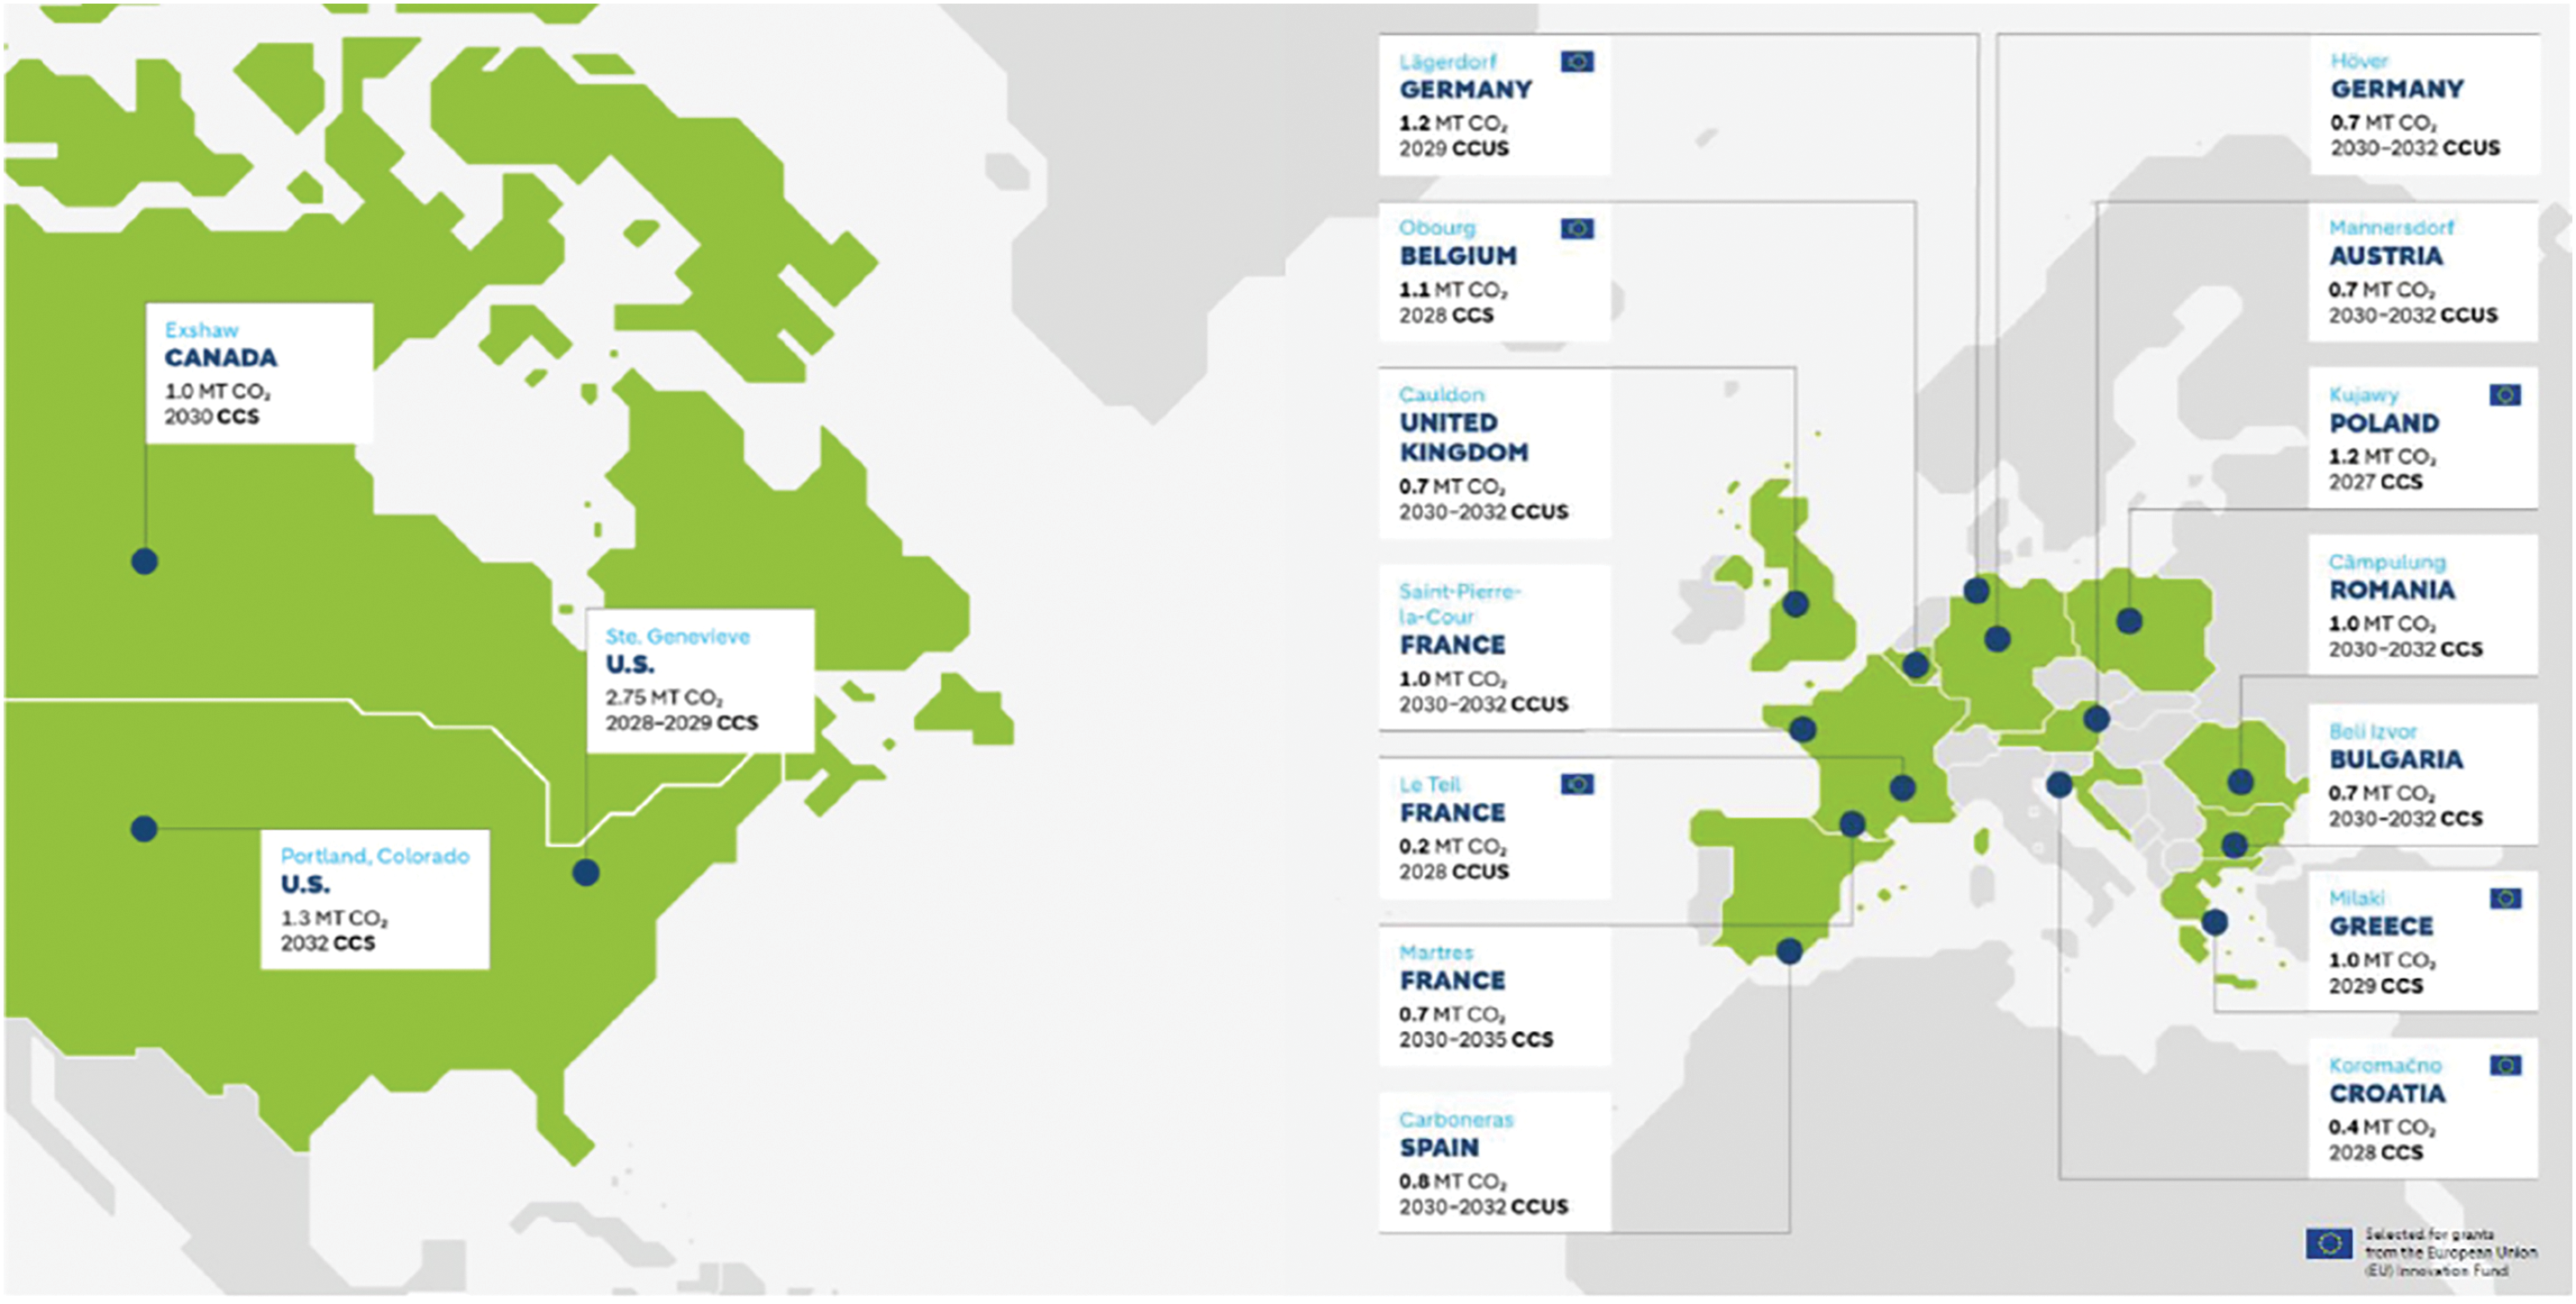
Figure 2 Holcim CCUS projects 2025 [4]
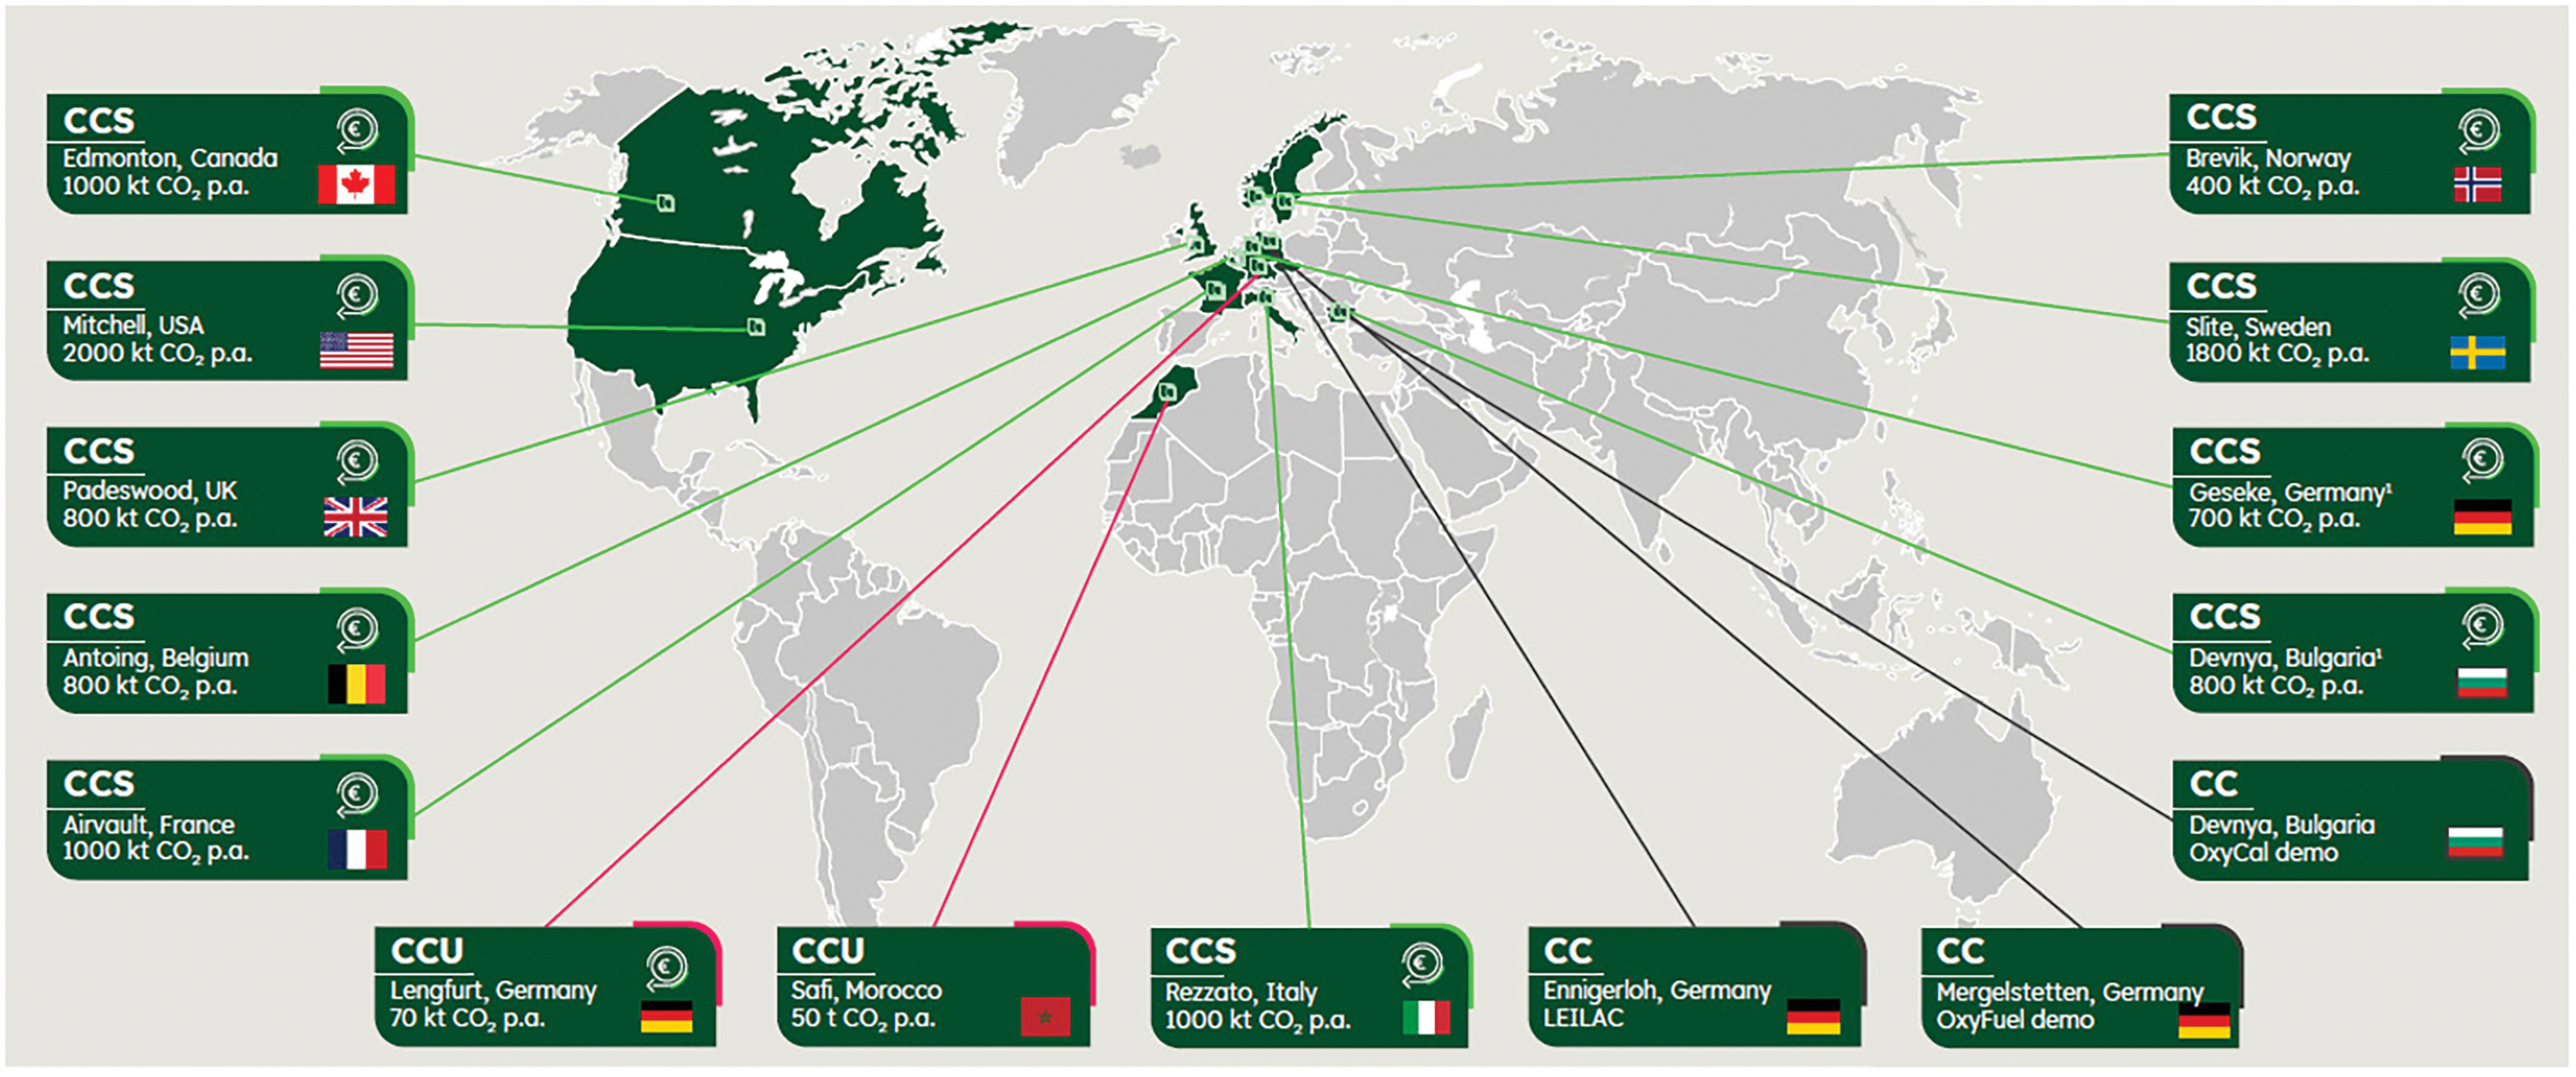
Figure 3 Heidelberg materials CCUS projects 2025 [5]
At a CCUS-conference in Hamburg this year [6], OneStone Consulting presented how the project situation has changed. Optimistically, it had been expected that after one year more large-scale projects would be at the planning stage. The actual result is that there have been more projects, especially ‘Front-End Engineering and Design’ (FEED) projects, which were opened to bridge the gap between technical feasibility and a Final Investment Decision (FID). However, the number of industrial-scale CCUS projects has even declined. The number of such projects that could be operational by 2030 has declined from 46 to 40 (Figure 4). 33 projects are in Europe and only 7 in the rest of the world. Figure 5 shows that in Europe most of the projects are in France (6), Germany (5) and Spain (3). Figure 6 shows a breakdown of the CCUS capacity of almost 35 Mta by cement company. Holcim and Heidelberg Materials are leading the sector, followed by Titan, Schwenk and Aalborg. Others include Cemex, CRH, Vicat, Molins, Dyckerhoff, Nexe, TCC, Taiheiyo, MUCC, Dalmia and China United.
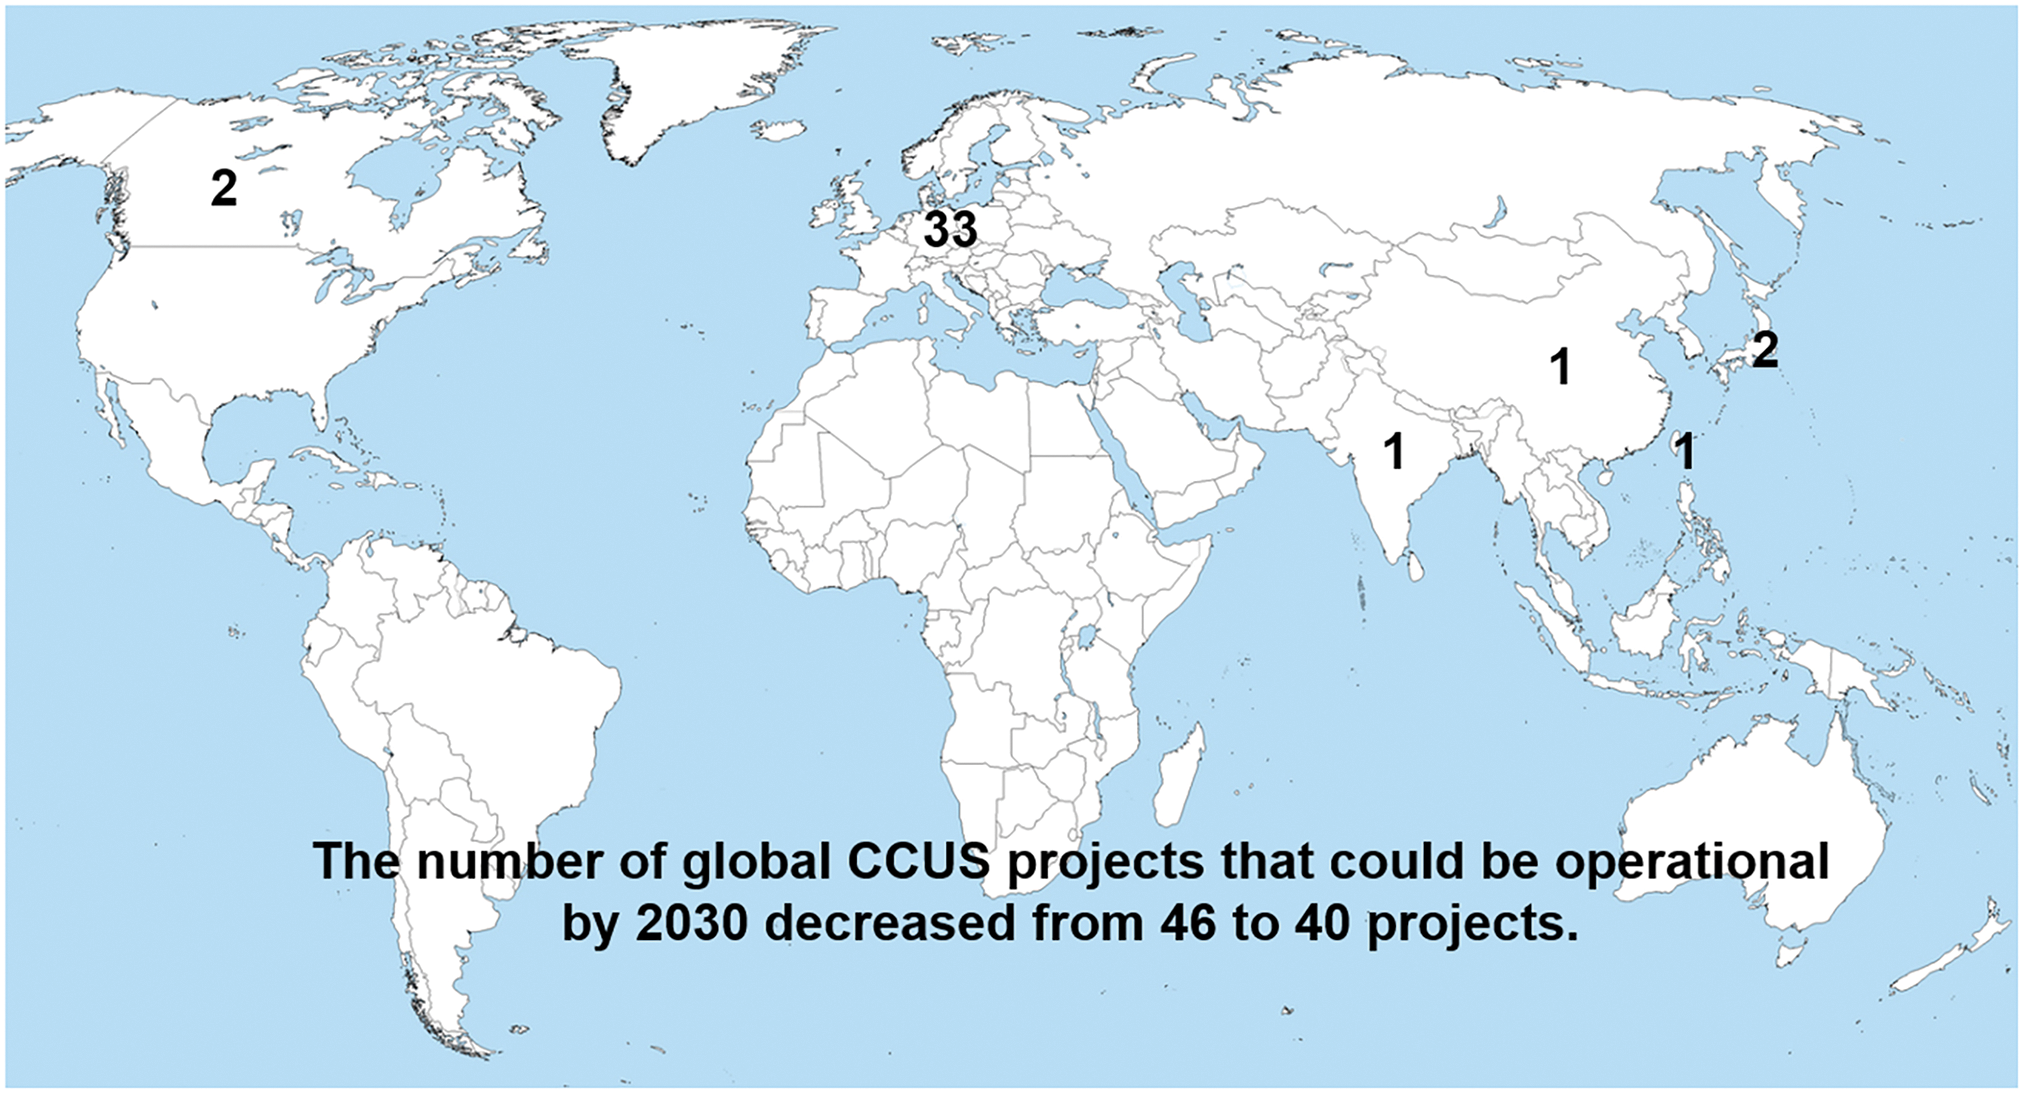
Figure 4 CCUS projects update 2026 (OneStone Consulting)
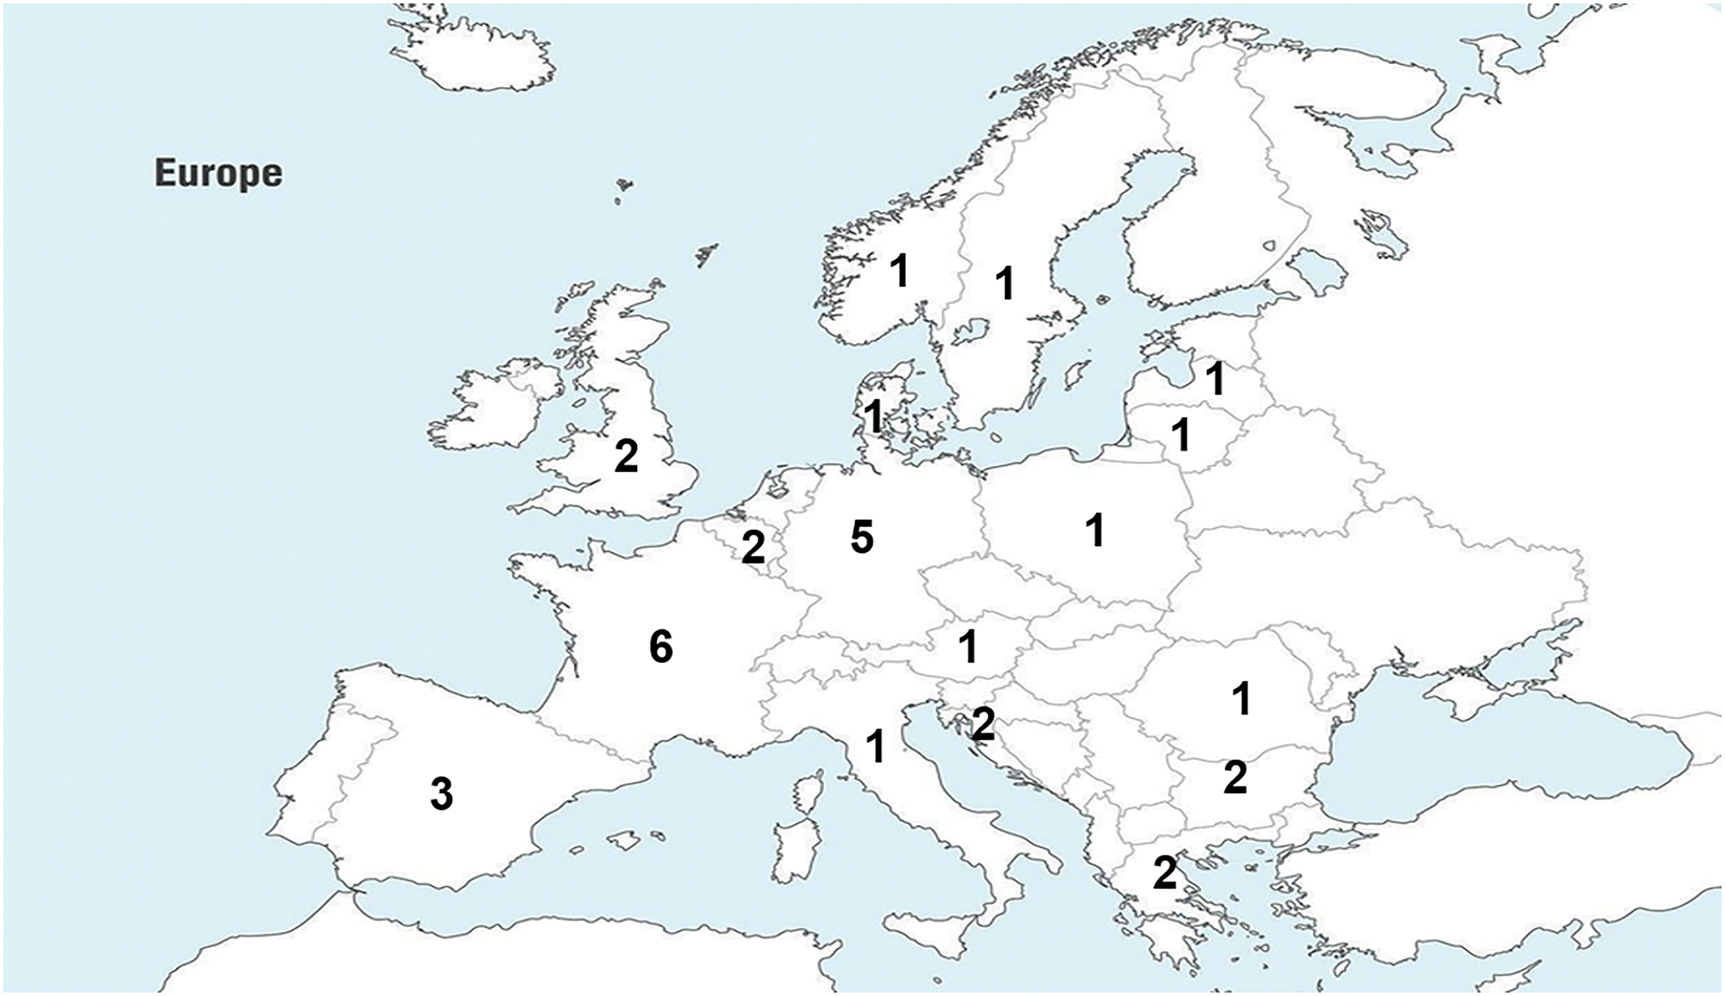
Figure 5 Breakdown of CCUS projects in Europe (OneStone Consulting)
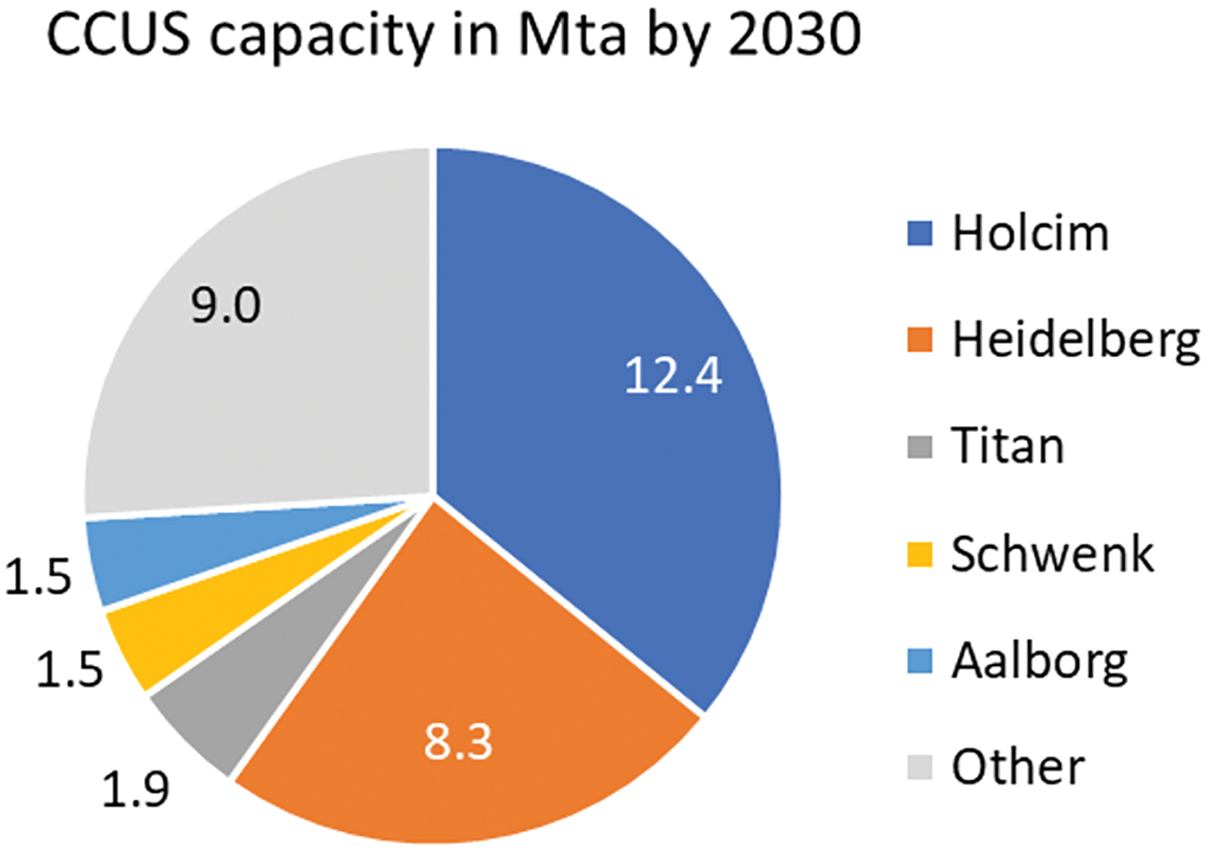
Figure 6 Breakdown of CCUS projects by cement company (OneStone Consulting). Others: Cemex, CRH, Vicat, Molins, Dyckerhoff, Nexe, TCC, Taiheiyo, MUCC, Dalmia, China United
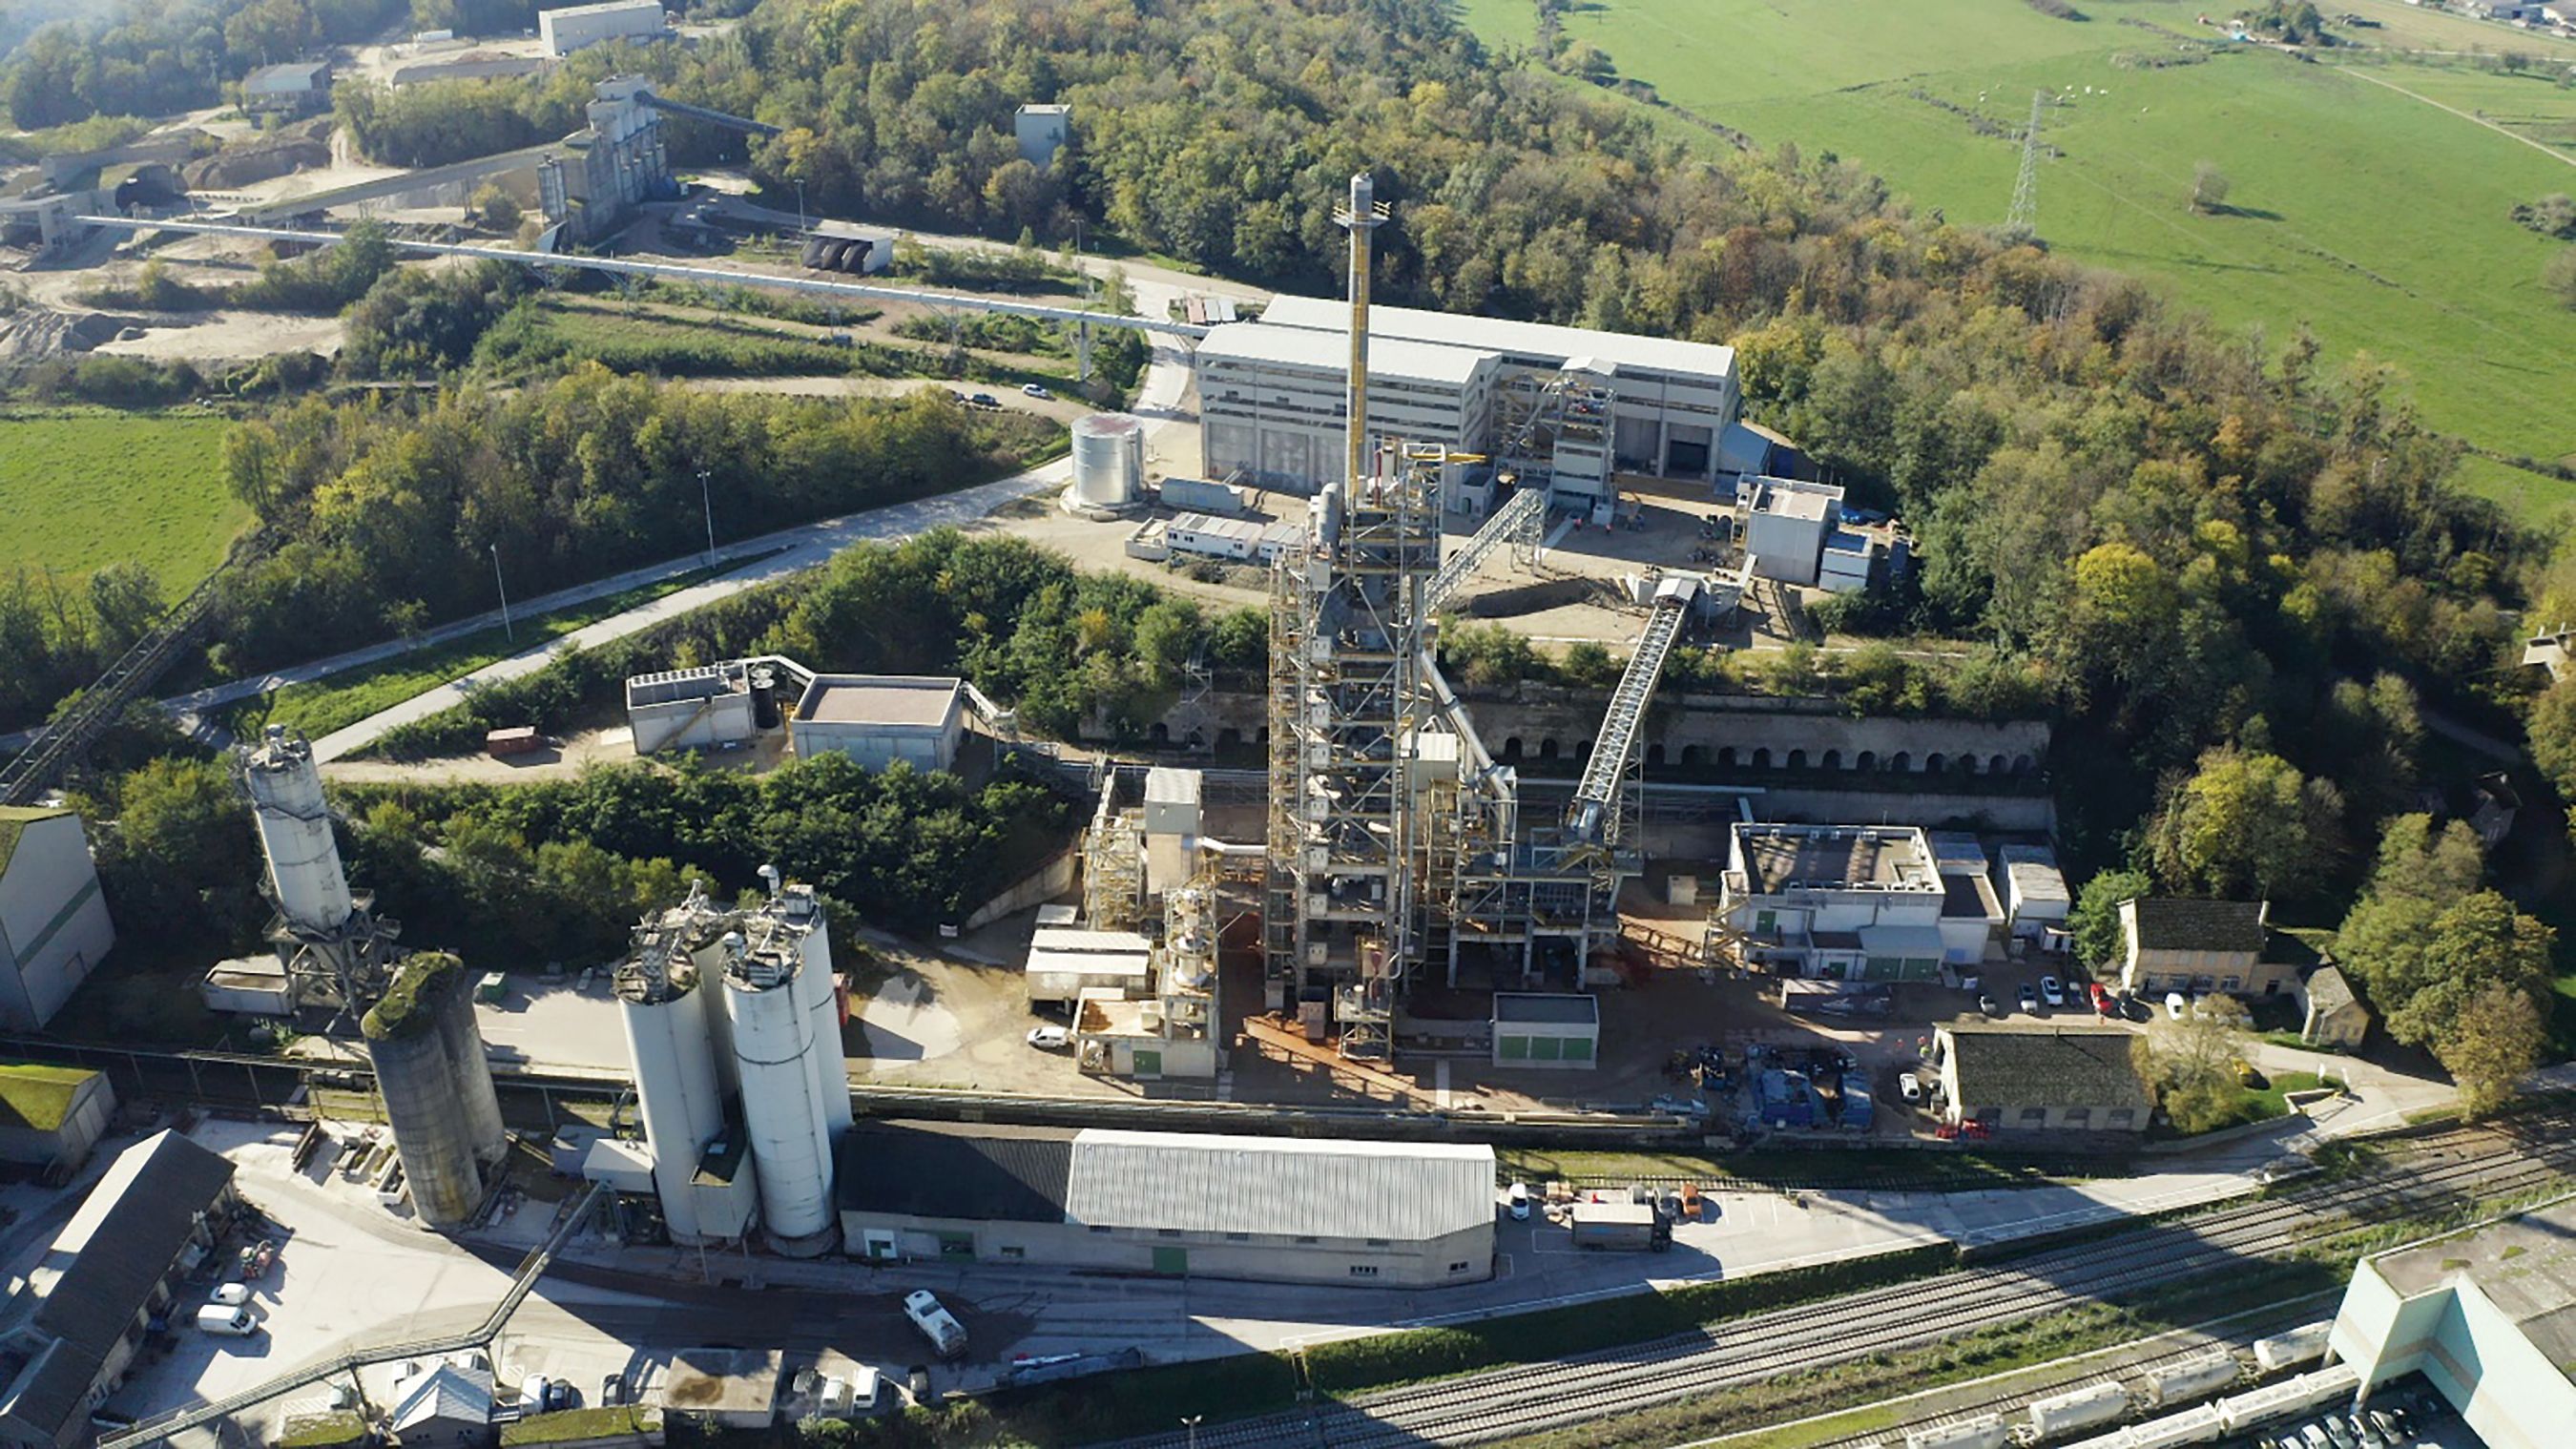
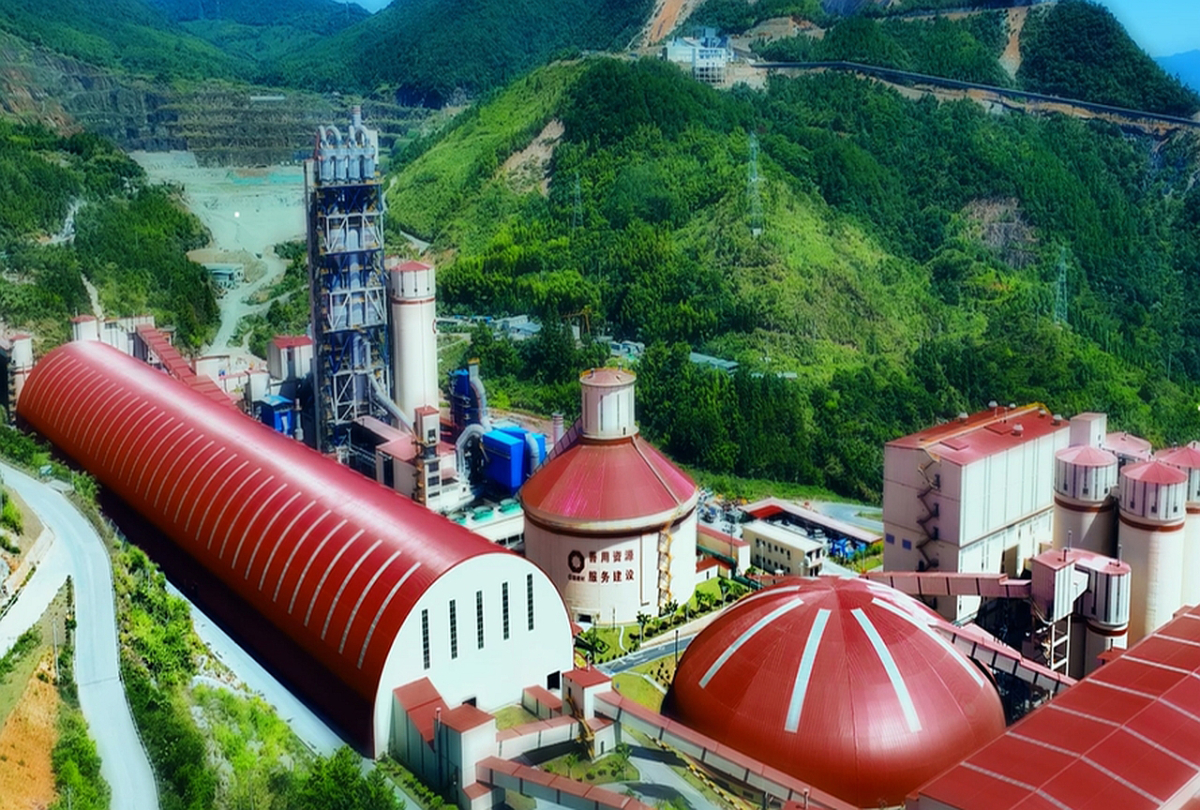
In Europe, the Airvault project (Figure 7) by Heidelberg Materials in France is outstanding. Two existing old kilns have been replaced by a new and modern 4000 tpd line in the first step. Commissioning was in May this year. In a second step, 1.0 of CO2 from the limestone calcination in the new kiln will be captured, starting in 2030. The CO2 will be liquefied and finally transported by ship to geological storage under the North Sea. According to press news, two other flagship projects were put on hold. The Go4Zero project at the Obourg cement plant (Figure 8) by Holcim in Belgium involved installation of a new cement kiln with an oxyfuel calciner with start-up in 2029. However, Holcim has put the project on hold, due to high risks and infrastructure uncertainties. The final investment decision (FID) is pending. The CCS system at the Slite cement plant (Figure 9) by Heidelberg Materials in Sweden was to capture up to 1.8 Mta of CO2, about 3% of the country’s total emissions. however, the project was paused after the Swedish Energy Agency rejected further co-financing and project is now uncertain.
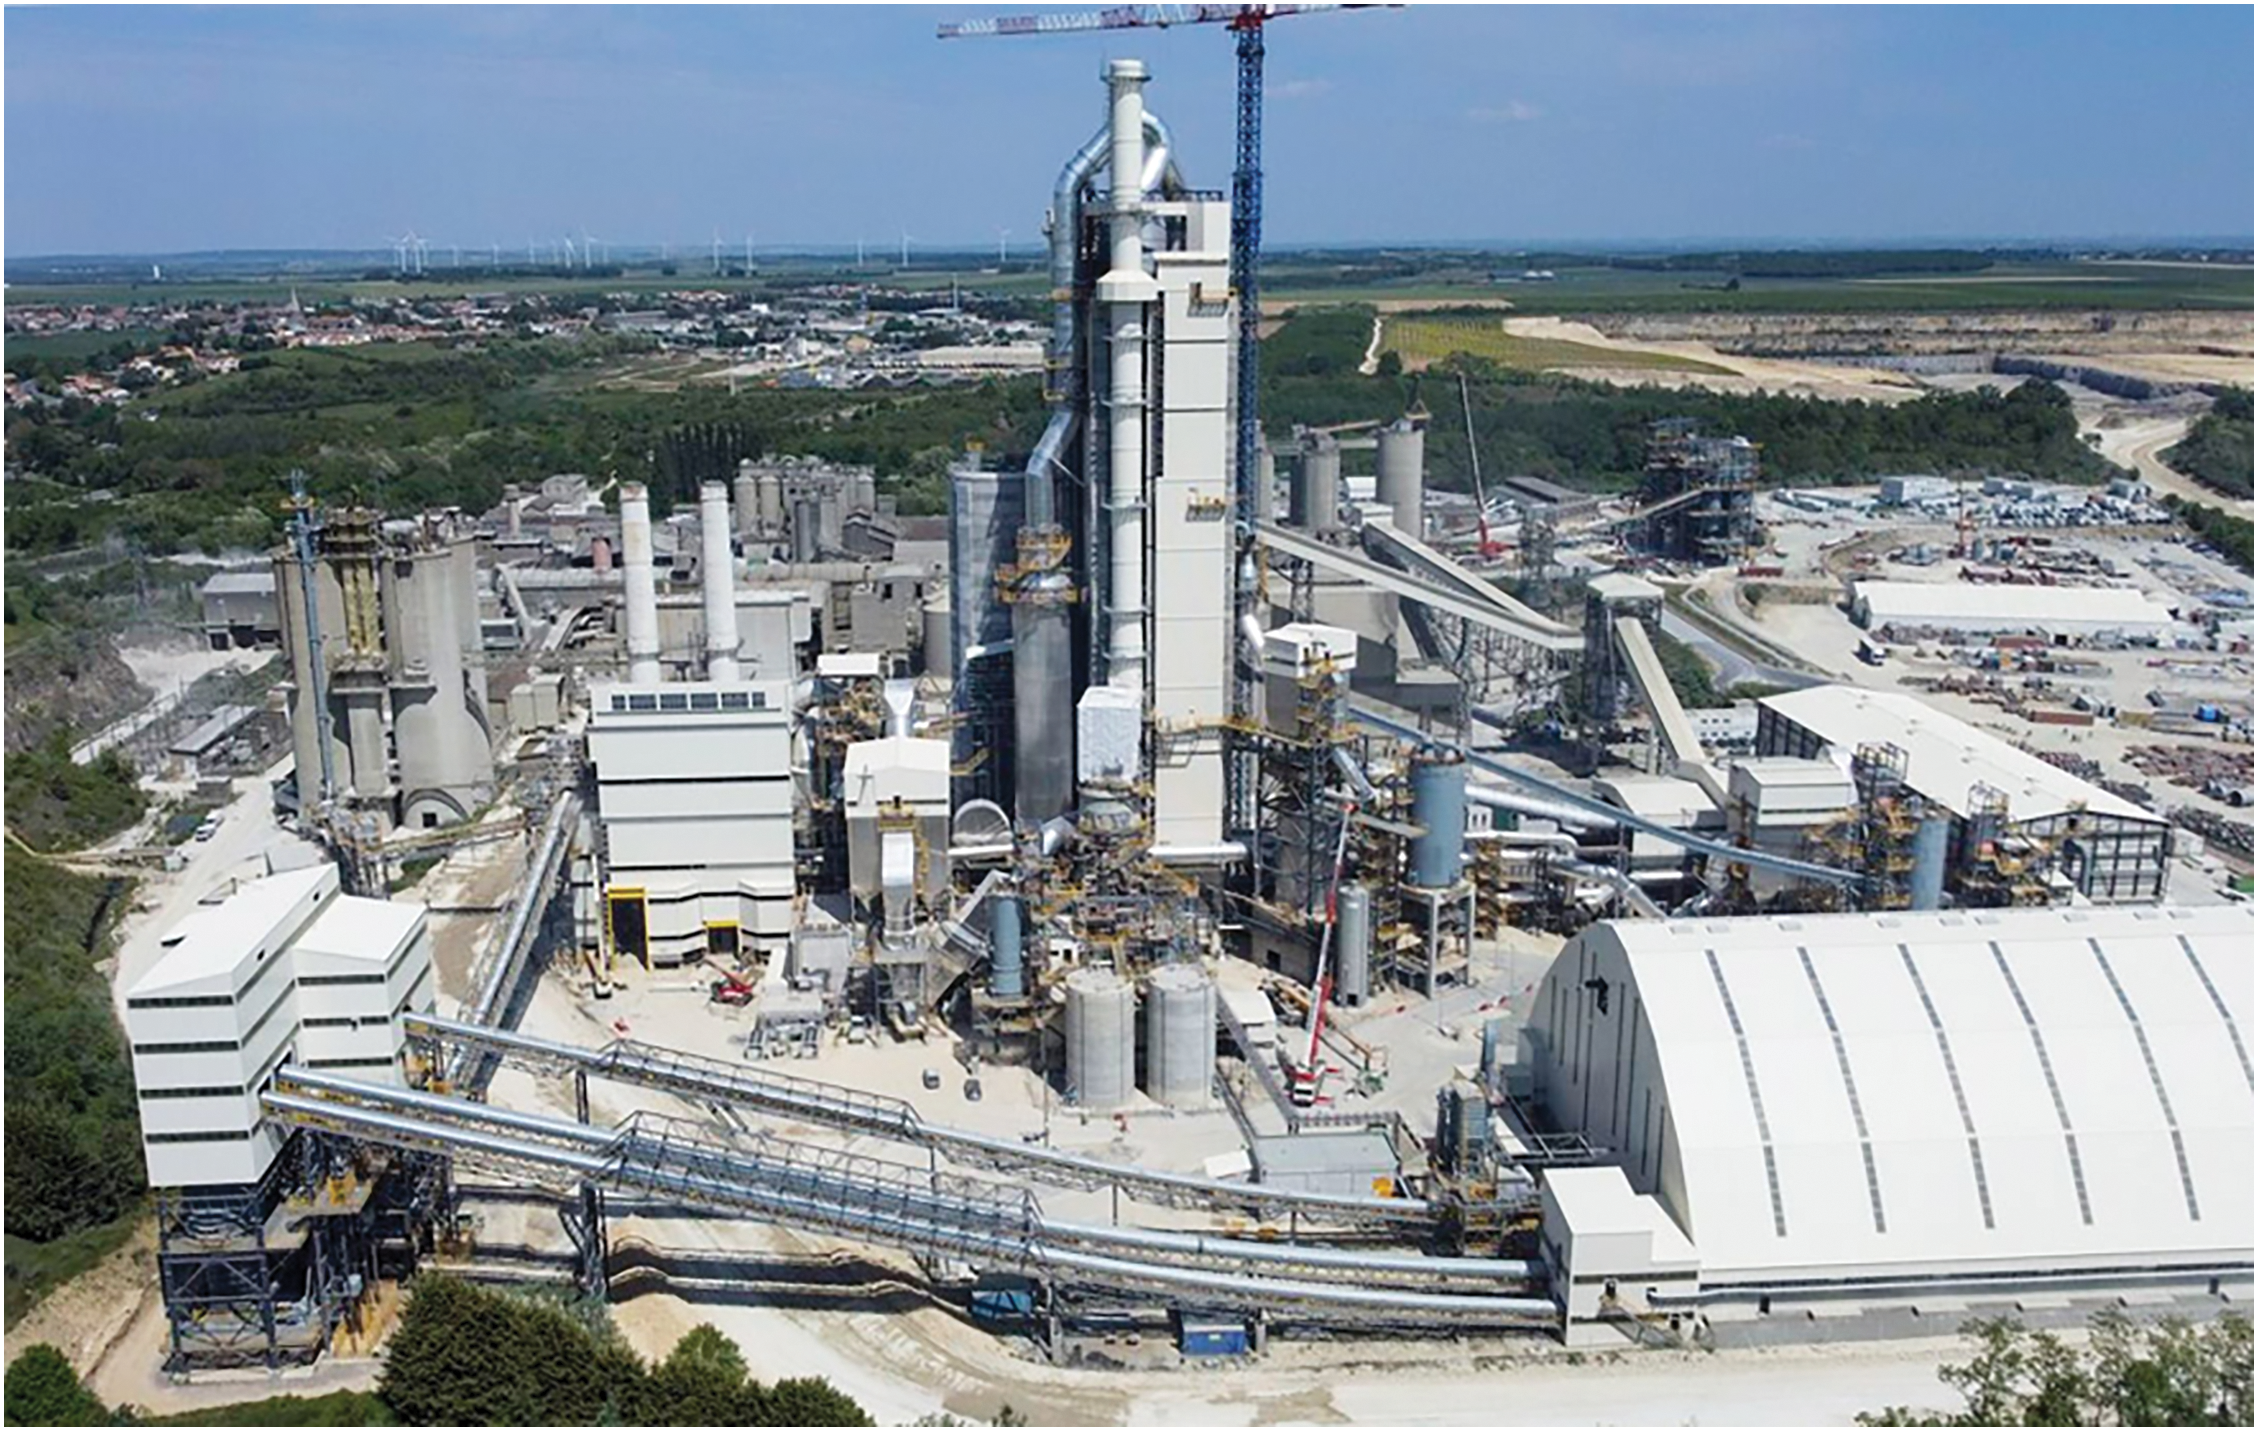
Figure 7 Airvault cement plant in France (Credit: Heidelberg Materials)

Figure 8 Obourg cement plant in Belgium (Credit: Holcim)
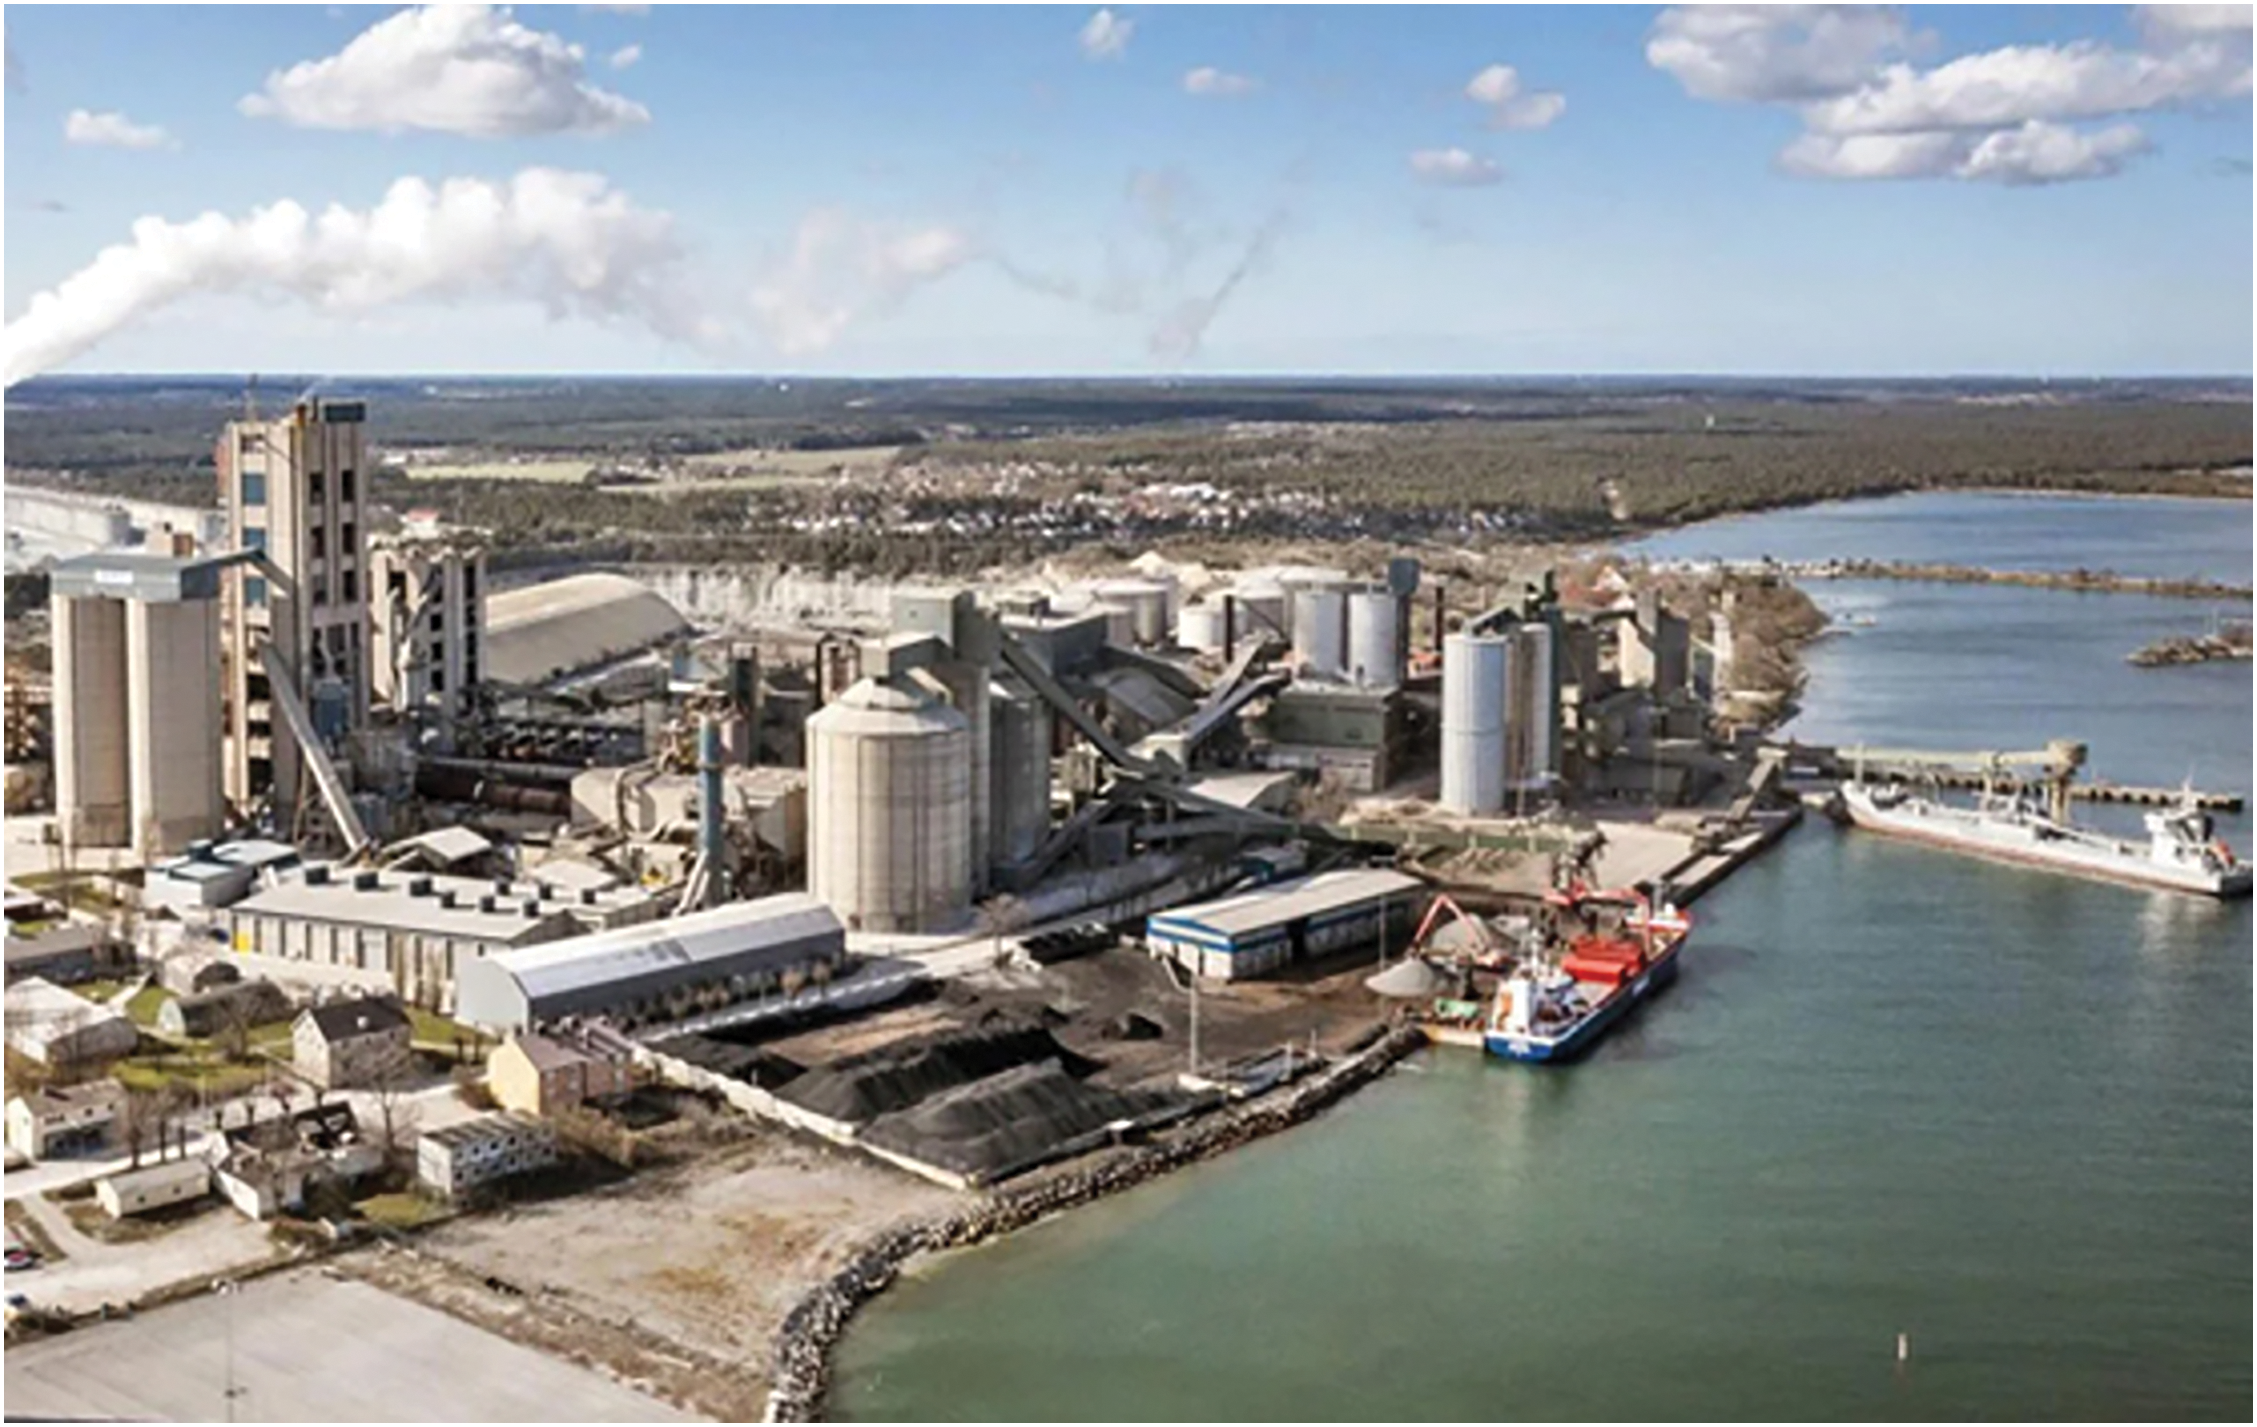
Figure 9 Slite cement plant in Sweden (Credit: Heidelberg Materials)
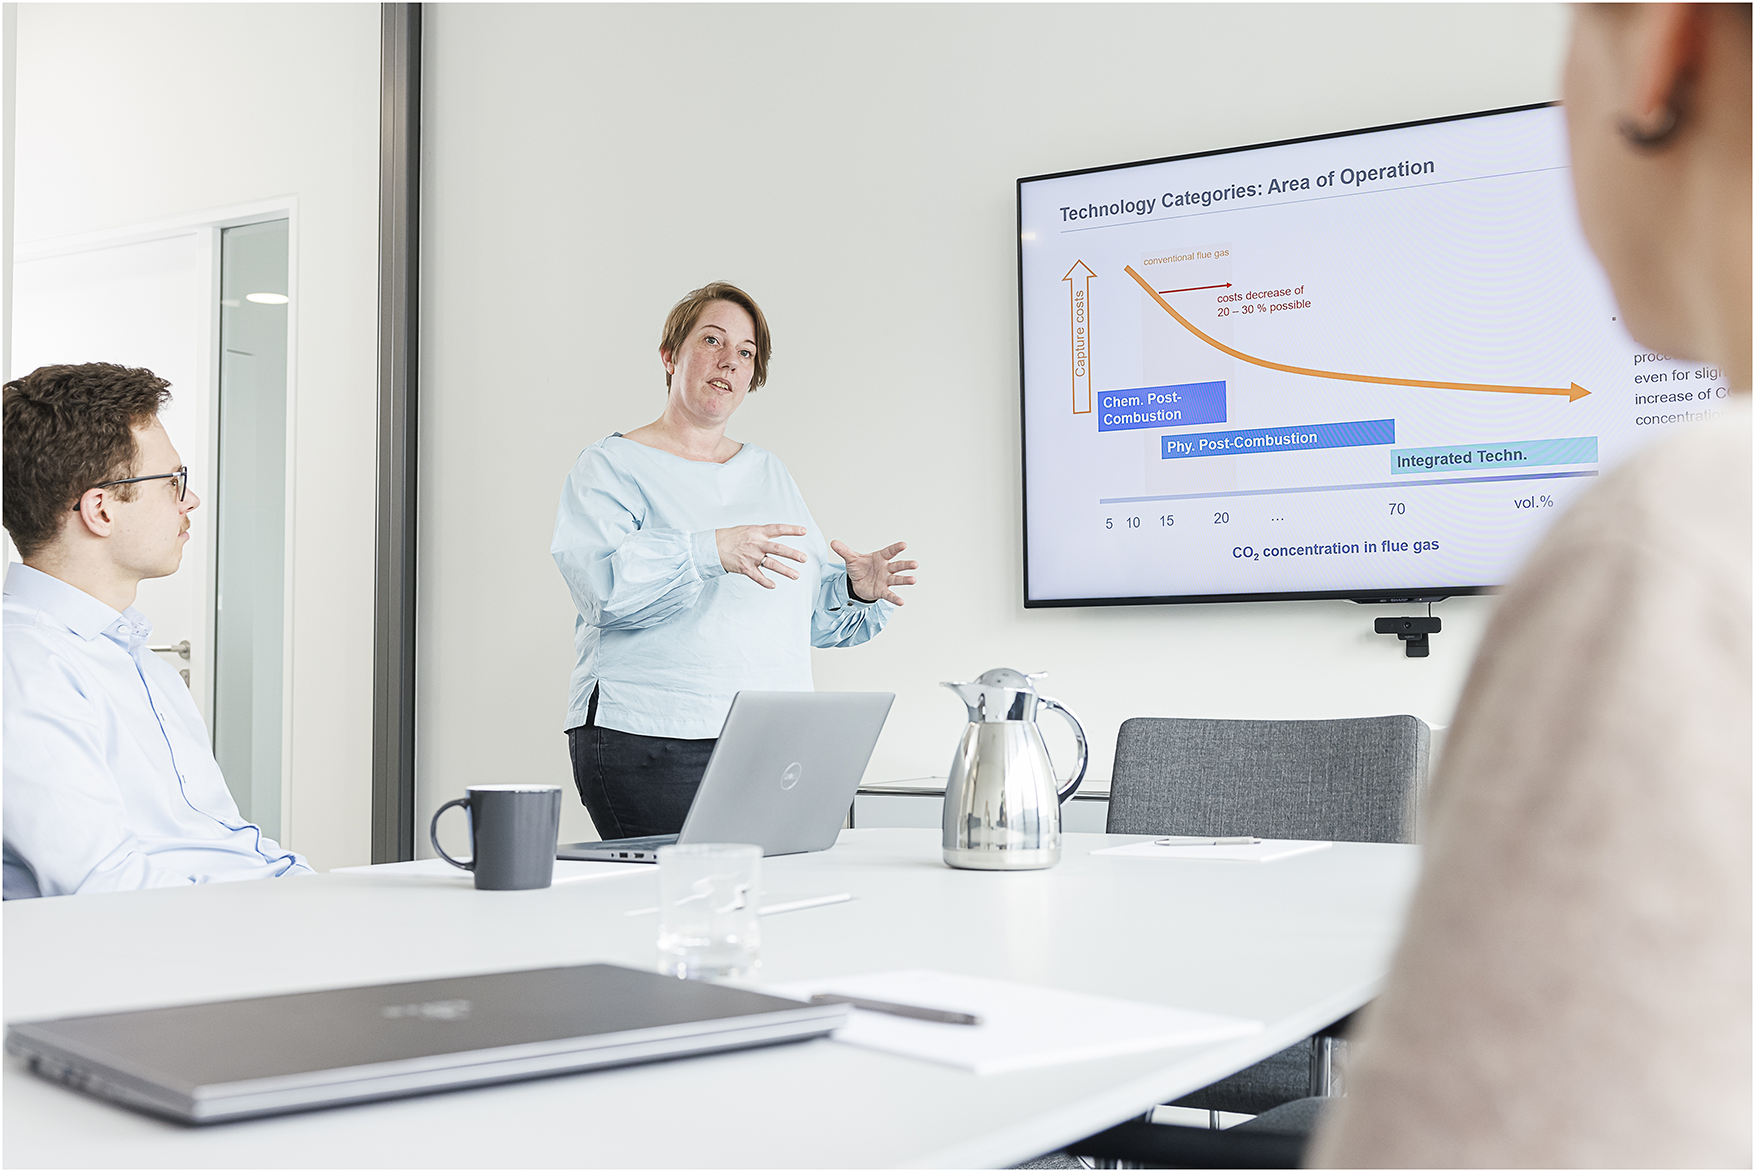
Carbon capture must become cheaper and easier to implement. This is one of the key messages from Dr. Kristina Fleiger of the German VDZ in an award-winning presentation at the Global CemCCUS conference in Hamburg in June this year [7]. In her presentation she highlighted the technical challenges cement plants face when implementing CCUS technologies and presented practical approaches to overcoming them (Figure 10). A key focus is the interface between the cement plant and the carbon capture unit. Very important is: Cement plant operators must do their homework first: reducing CO2 emissions at the source and preparing plant operations for future carbon capture integration. In the operation of real cement plants, there are significant fluctuations of the CO2 and O2 concentrations, temperatures and flow rates of the flue gas. The CO2 concentrations can vary between 1.5 2.5% in the compound mode and up to 2.4–4.0% in the direct mode, while the volume flow can vary 4–6% in the compound mode and 4–20% in the direct mode.
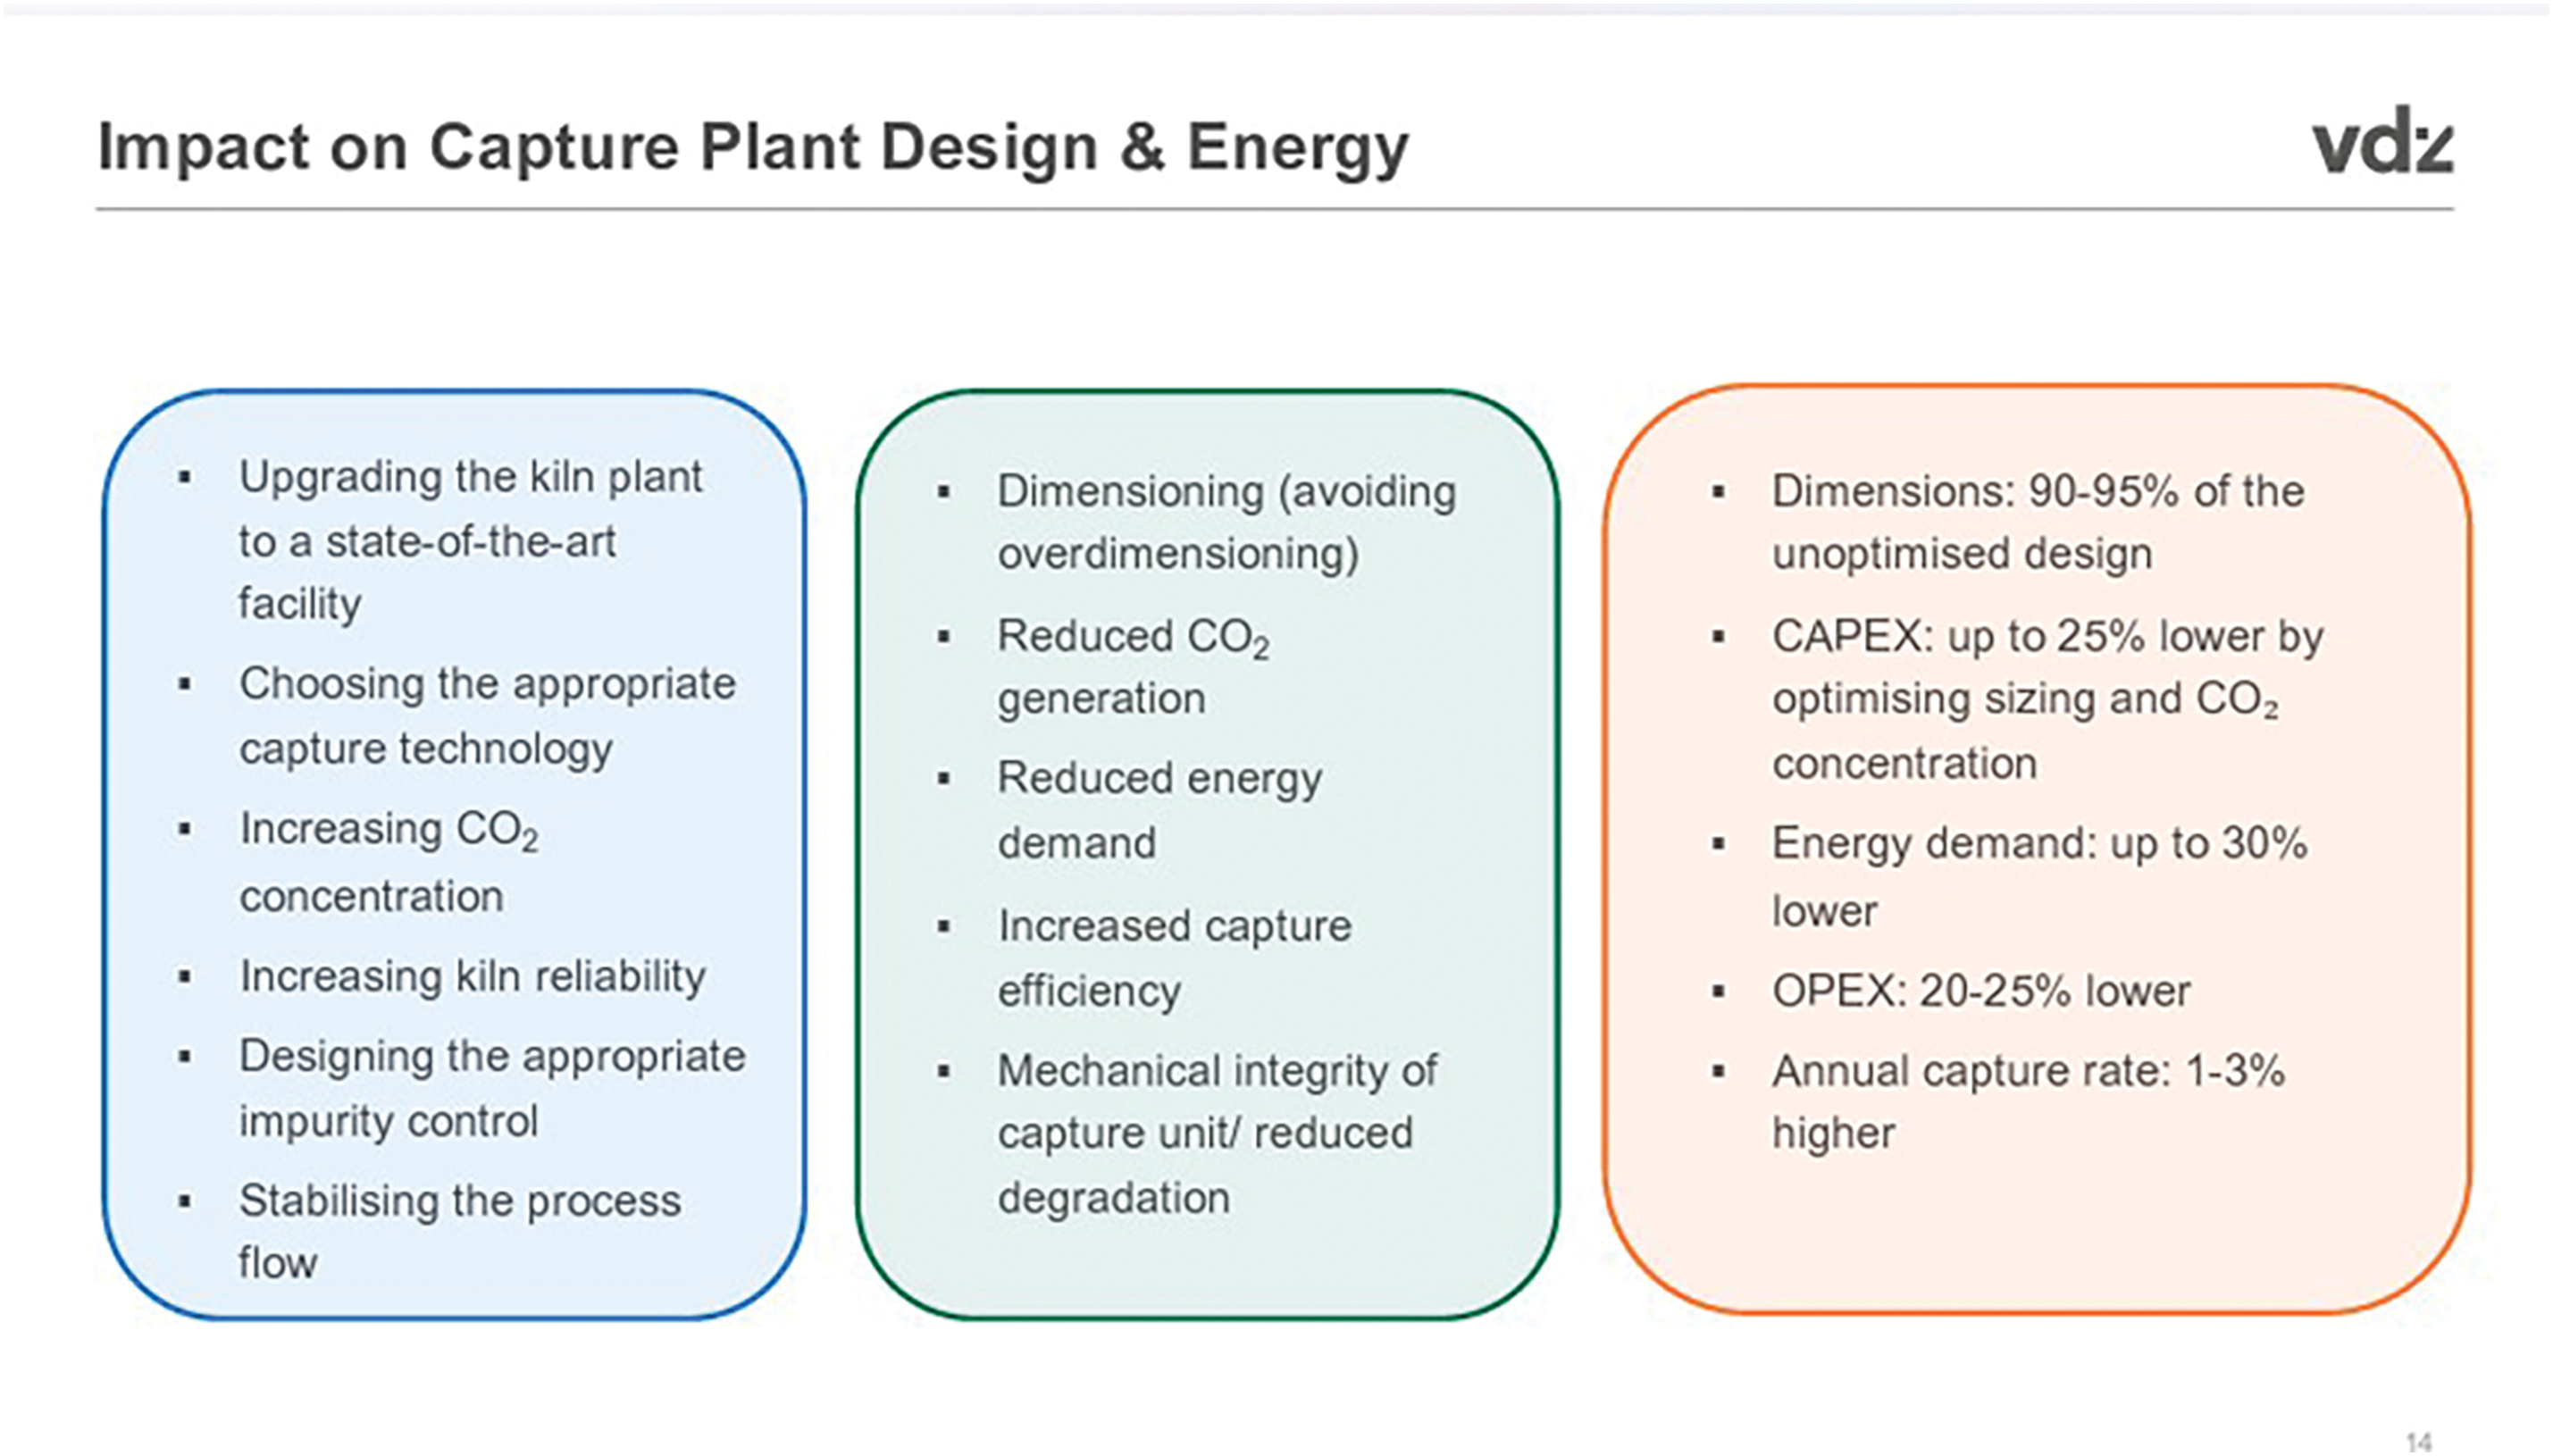
Figure 10 Impact on capture plant design and energy [7]
The fluctuations are mainly due to inhomogeneities in raw materials and fuels, caused especially by alternative materials, but also have to do with the peak management and operational dynamics such as kiln-stops. The result is that in CCS systems there is a major influence of the flue gas fluctuations on the carbon capture rate and capture efficiency. Conflicting objectives such as high biomass in alternative fuels and the stability in the kiln process need to be addressed and solved. Accordingly, capture costs not only depend on the chosen CCS technology but also on the mechanical condition of the plant and the set-up of the process flow. This shows the complexity and risks of CCUS systems, which have recently been addressed by Holcim in a new contract awarded to global engineering company Worley, covering the downstream systems as well. Worley will provide engineering oversight, project management, and engineering integration from its legacy experience in gas processing compression and transportation to 14 Holcim projects in Europe, including 8 supported by the EU Innovation Fund.
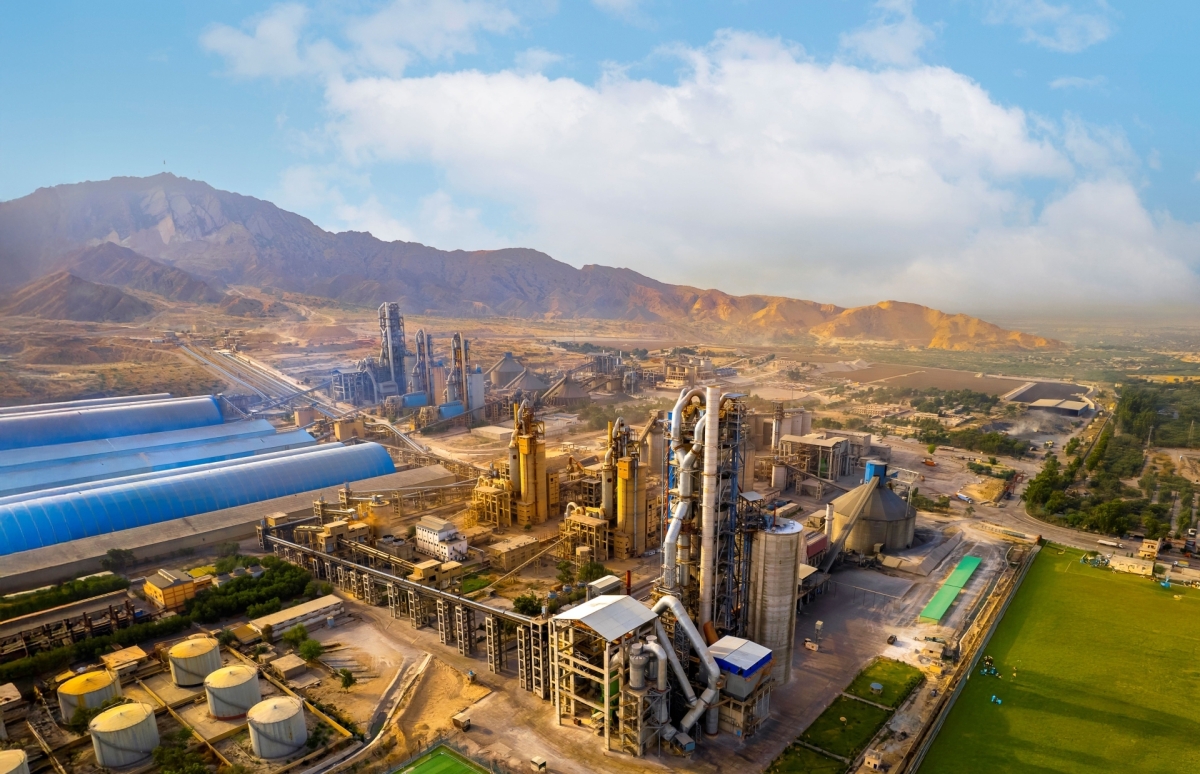
Although Heidelberg Materials still regard CCS as a key lever to achieve climate goals, strategies have changed [8]. Because the costs for CO2 transport and storage can be as high as the capture costs, the transport and storage challenges have been fully reviewed and optimised. One such example is the ANRAV CCS project at the Devnya cement plant in Bulgaria (Figure 11). In the first concept, the captured CO2 from the plant near Varna should be connected with offshore storage sites of oil and gas company Petroceltic under the Black Sea. In the latest approach, Heidelberg Materials decided on a 20 km pipeline transport and CO2 storage in an underground reservoir close to the cement plant. This will reduce the downstream decarbonisation costs significantly. However, project optimisation is still continuing, including the ANRAV project as well as most other projects where a CO2 storage in a reservoir close to the plant is an option.
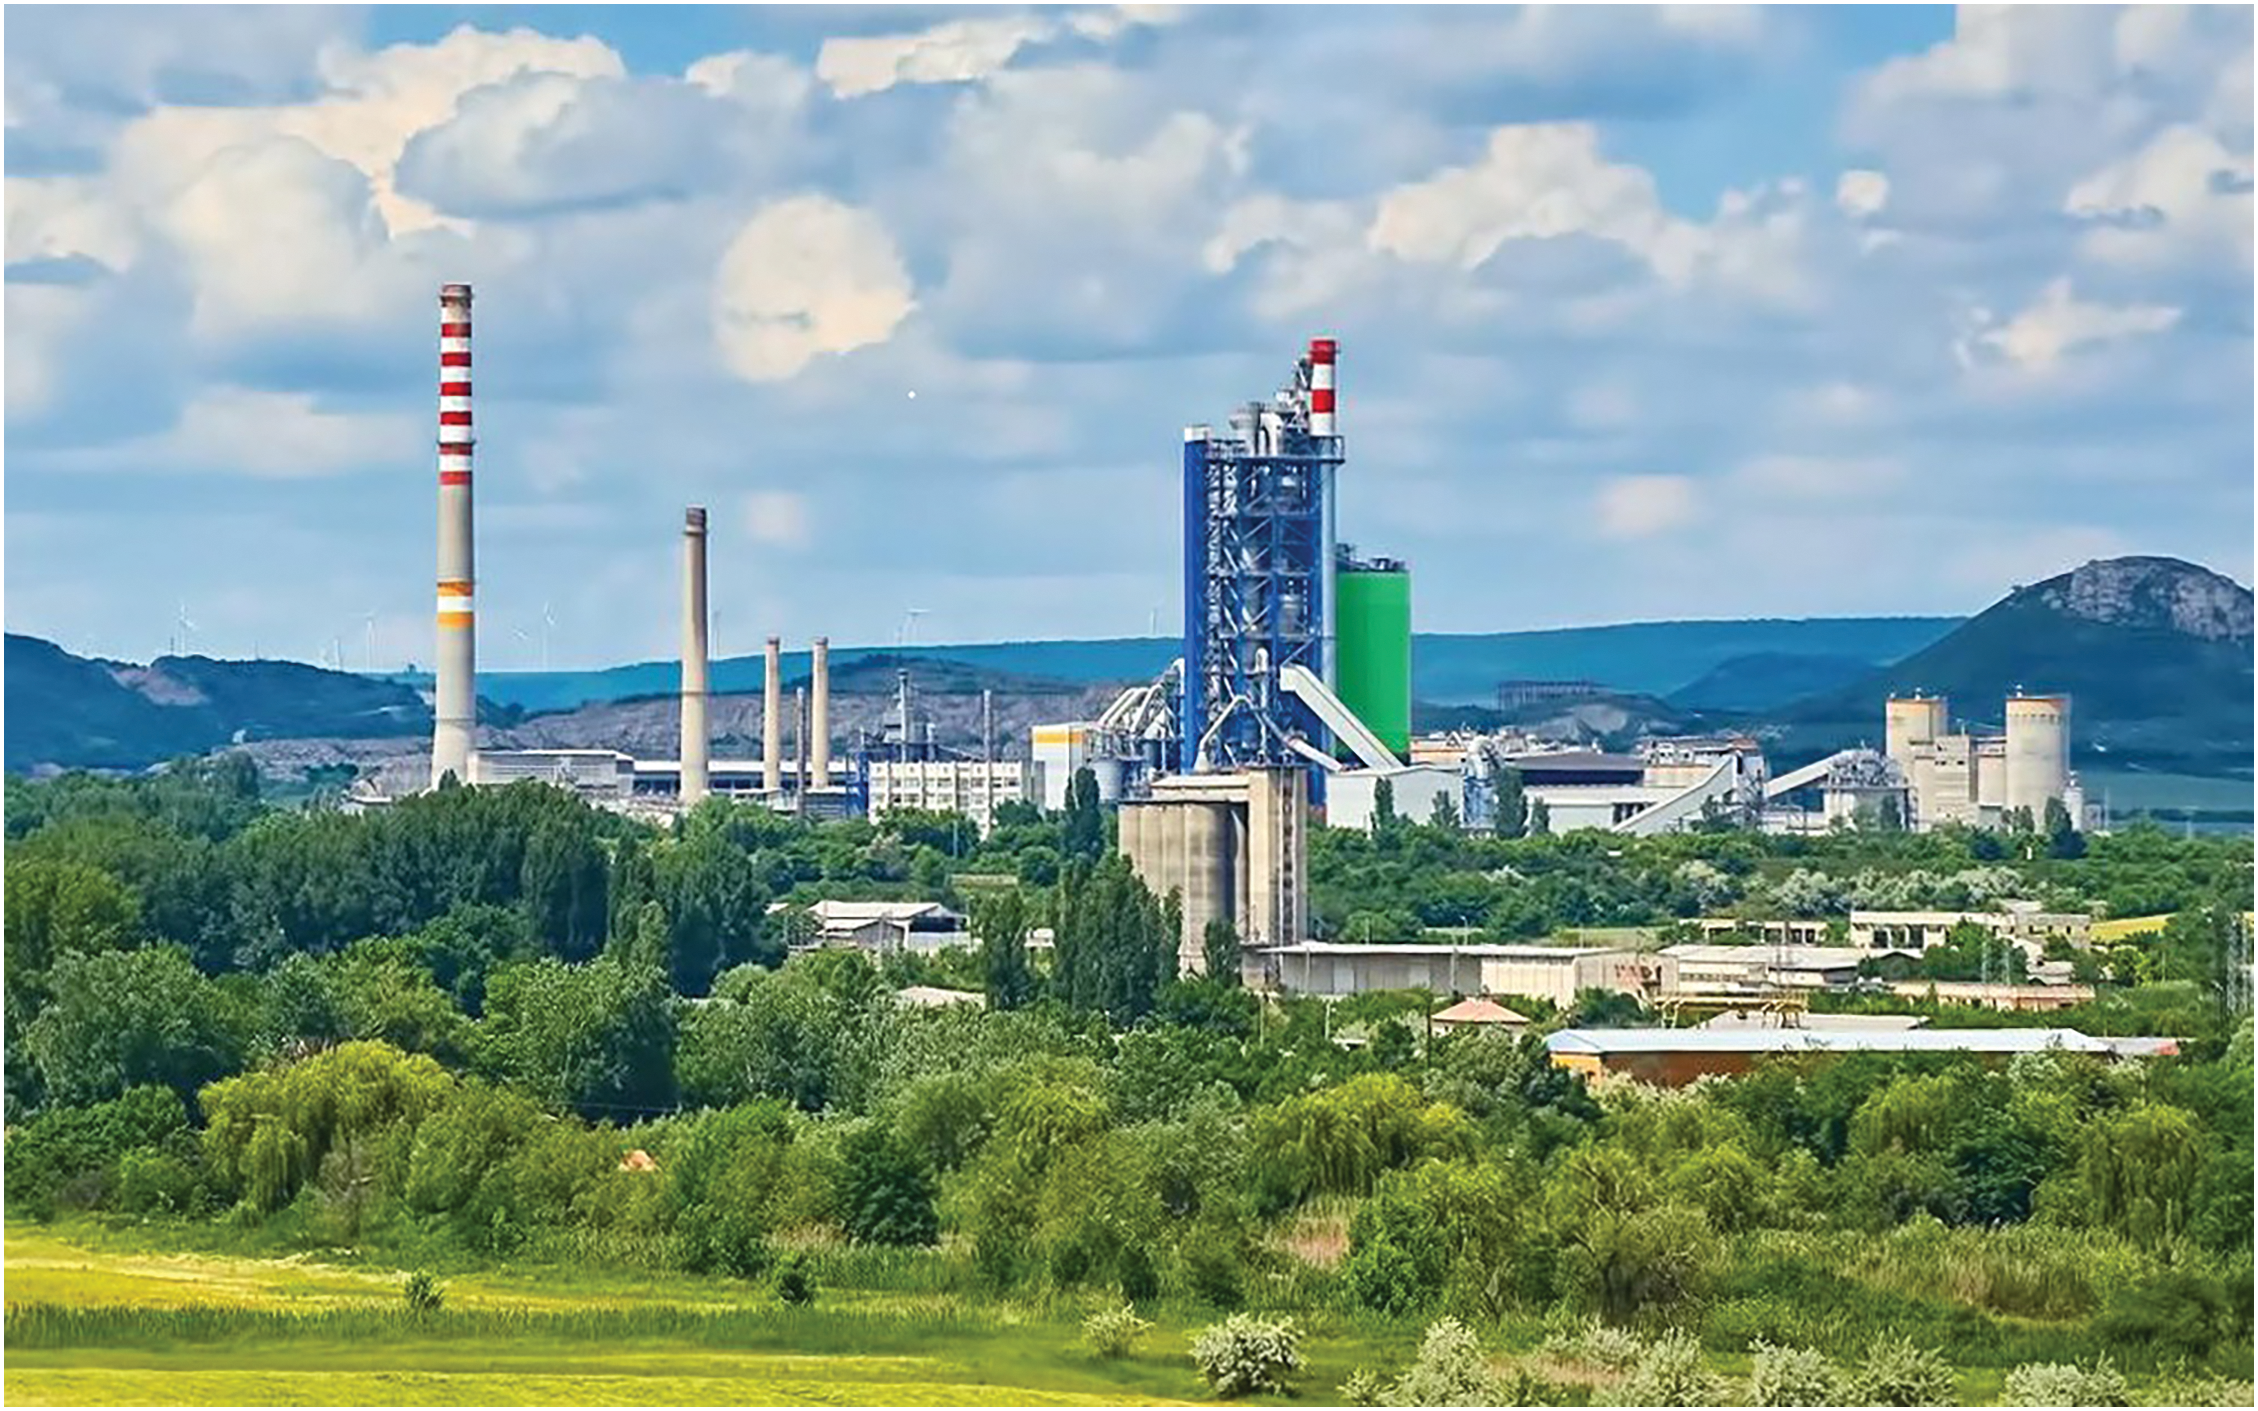
Figure 11 Devnya cement plant in Bulgaria (Heidelberg Materials)
In the cement industry, the projections for CCUS have changed over the years. In a first approach, a ‘Technology Roadmap’ in 2018 produced by the International Energy Agency (IEA) together with the Cement Sustainability Initiative (CSI) asserted that the share of CCUS systems in cement decarbonisation up to 2050 would be 25% (Figure 12) or about 450 million t CO2 capture capacity per year (Mta) [9]. In recent roadmaps by cement companies and cement associations, the role of CCUS is a different one. It is propagated that with CCUS it is possible to achieve zero or negative CO2 emissions on the long-term net-zero goal in 2050. The CEMBUREAU roadmap (Figure 13) (now Cement Europe) projects that with CCUS 20.5% of the CO2 emissions by the European cement industry will be captured already in 2030 and 46.5% in 2050 [10]. These projections are based on the specific CO2 emissions/t of cementitious (cem) material, which was 804 kg CO2/t cem material in 1990 [11].
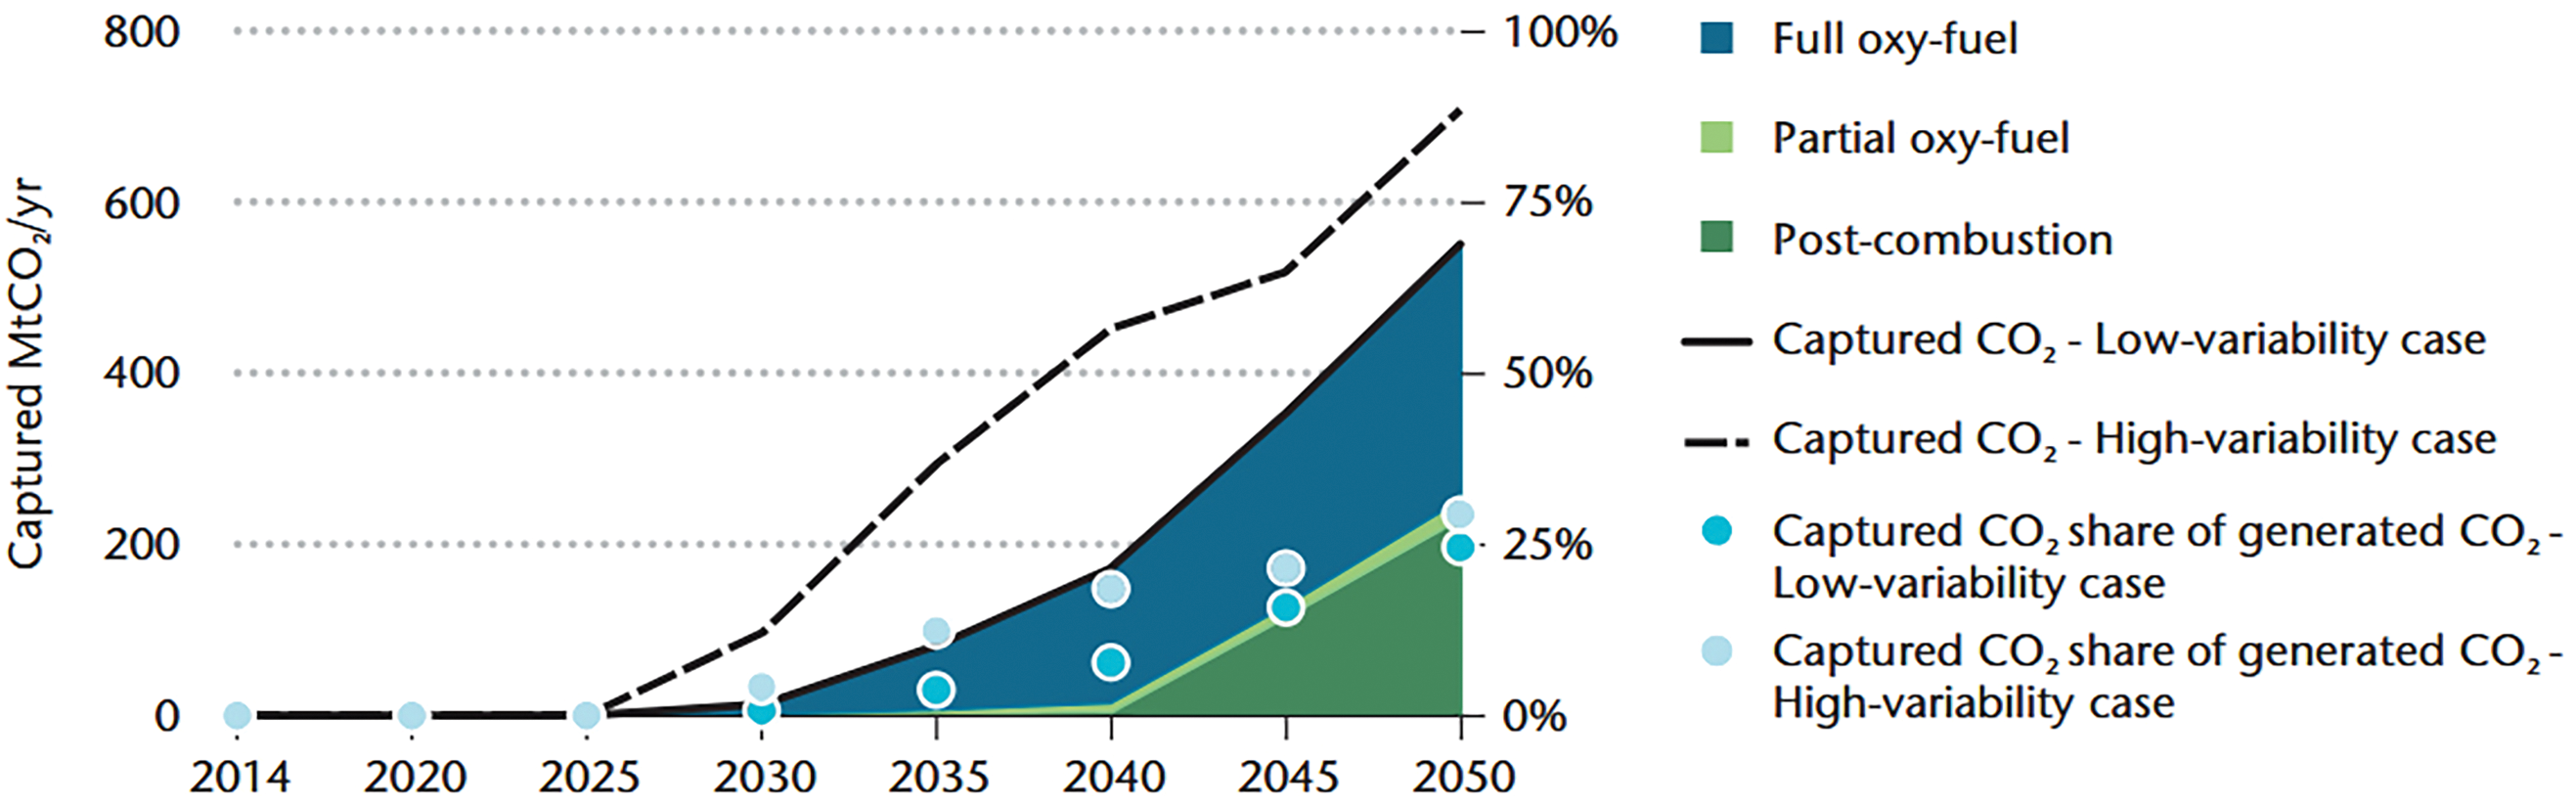
Figure 12 IEA CCUS projection [9]
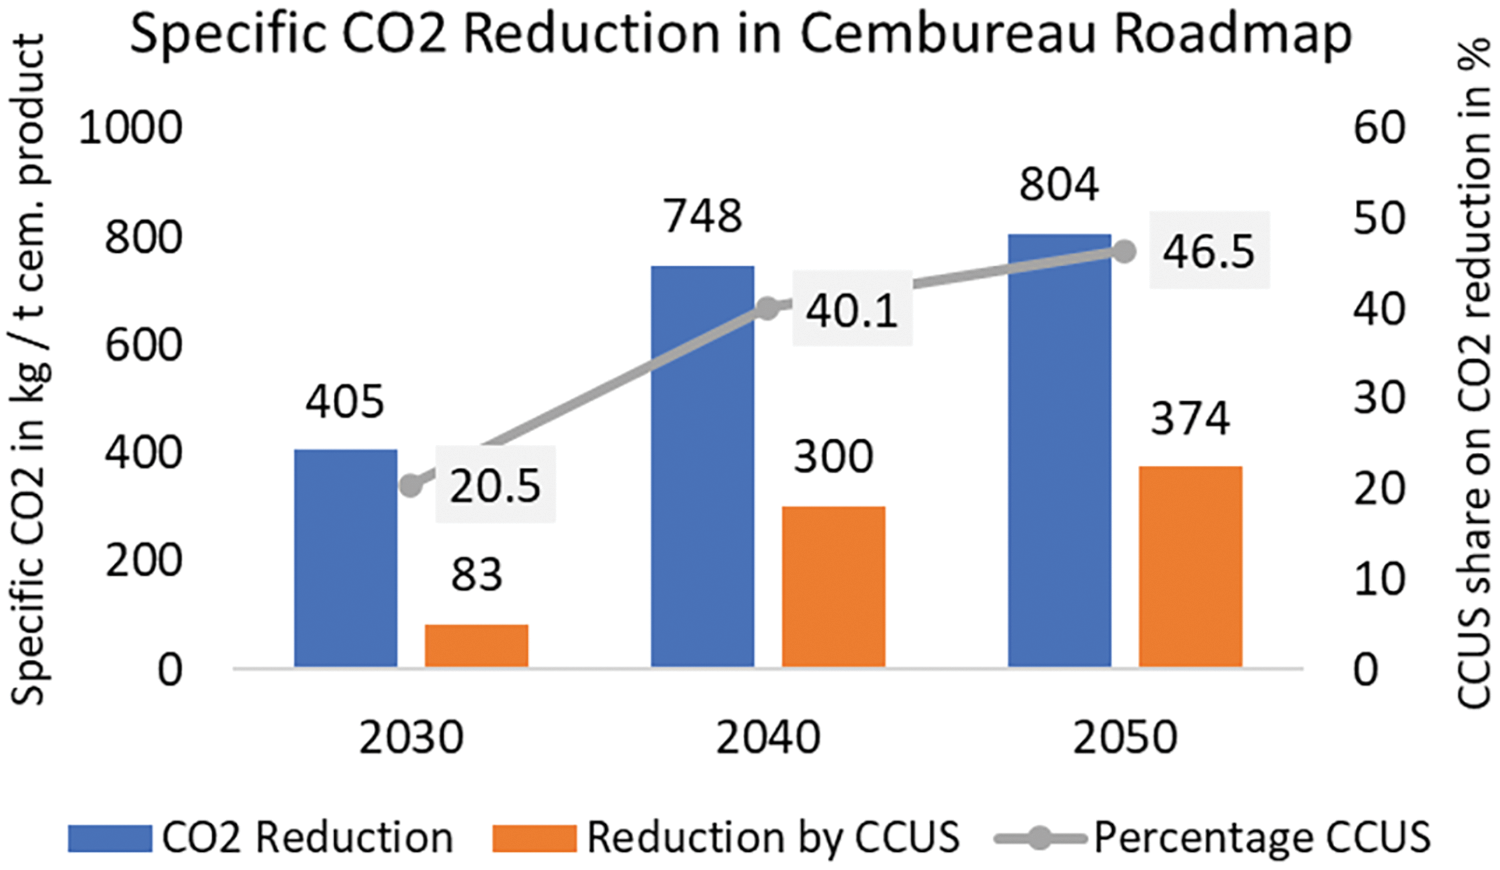
Figure 13 CEMBUREAU CCUS projection [10] (OneStone Consulting)
In their 2050 roadmap, the Global Cement and Concrete Association (GCCA) calculated that CCUS systems will be responsible for 36% of the CO2 reductions by the cement industry (Figure 14) [12]. This percentage corresponds in their calculation to 1370 Mta of CO2 eliminated by CCUS systems mid-century. It is very strange that in these projections the actual situation of the cement industry is not covered. Globally, from all the 40 identified projects a CCUS capacity of only <35 Mta will be available by 2030. The 20.5% CCUS projection 2030 by Cement Europe corresponds to 83 Mta being captured in Europe alone, for which at least 105 Mta CCUS capacity with a 79% utilisation is required. Global projections by the GCCA foresee the elimination of a total CO2 output of 1370 Mta by 2050. With a capacity utilisation of 85%, this requires about 1610 Mta of CCUS capacity, which is more than 45 times more than what will be available in 2030. This shows how unrealistic and wrong these official roadmaps are.

Figure 14 GCCA decarbonisation projection [11]
In their CCUS market report [3] from last year, OneStone Consulting came to the conclusion that even in the best ‘Green’ case CCUS-systems will, at a maximum, only reduce up to 12% of the CO2 emissions by the cement industry in 2050 (Figure 15). Beside the number of CCUS systems and their operational capacity, the percentage mainly depends on the global clinker production and accordingly on the measures introduced to reduce the clinker content in cement. The reduction of the clinker factor and other conventional measures will achieve the largest contribution to the decarbonisation of the cement industry. OneStone Consulting expects that this proportion will increase up to 70%, more than in any other projection that has ever been made. Anyhow, even in this case, by 2050 conventional measures and CCUS will not achieve a full decarbonisation. Even in the best case about 20% of CO2 emissions will still be released to the atmosphere and contribute to global warming.
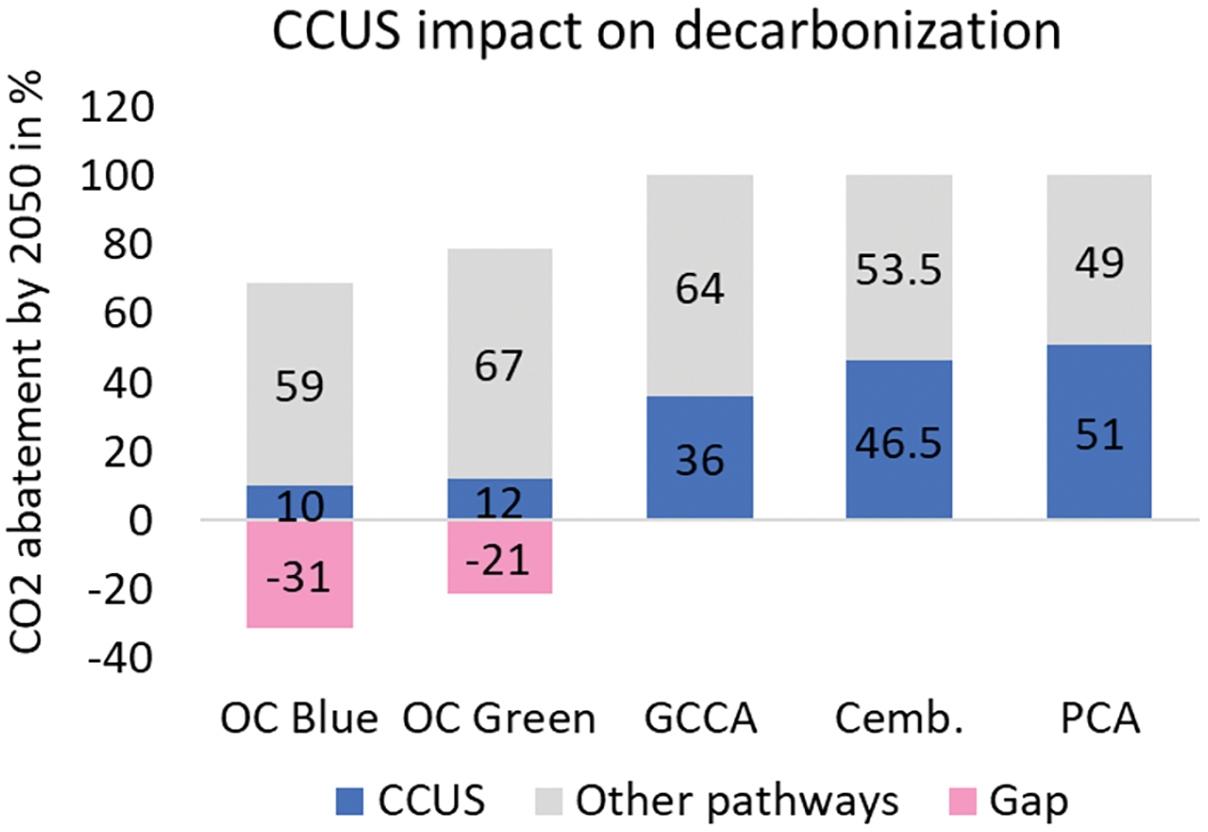
Figure 15 OneStone Consulting CCUS projection [3]
CCUS systems are very capital expensive and contribute significantly to the cement production costs. A detailed cost analysis, including the downstream processes, is provided in [13, 14]. CCUS avoidance costs measure the net cost to prevent one metric ton of CO2 from entering the atmosphere, accounting for both the annualised investment and maintenance costs and the extra energy and operational costs required to run the system. Up to now these costs differ widely depending on the technology, downstream system and location. Table 1 shows the comparison of a fictional 1.5 Mta cement capacity plant in Europe with and without a CCUS system. In 2025 the plant had a specific CO2 emission of 480 kg/t cement, while the ex-works cement price has been given as 120€/t. It is assumed that by 2035 Plant A can reduce its CO2 emissions with conventional measures by 30.2%, while Plant B with a CCUS system reduces its CO2 emissions by 90.6% to 45 kg/t cement. The question regarding which plant is more economical depends on the CO2 tax in 2035 and the prospective CO2 avoidance costs.
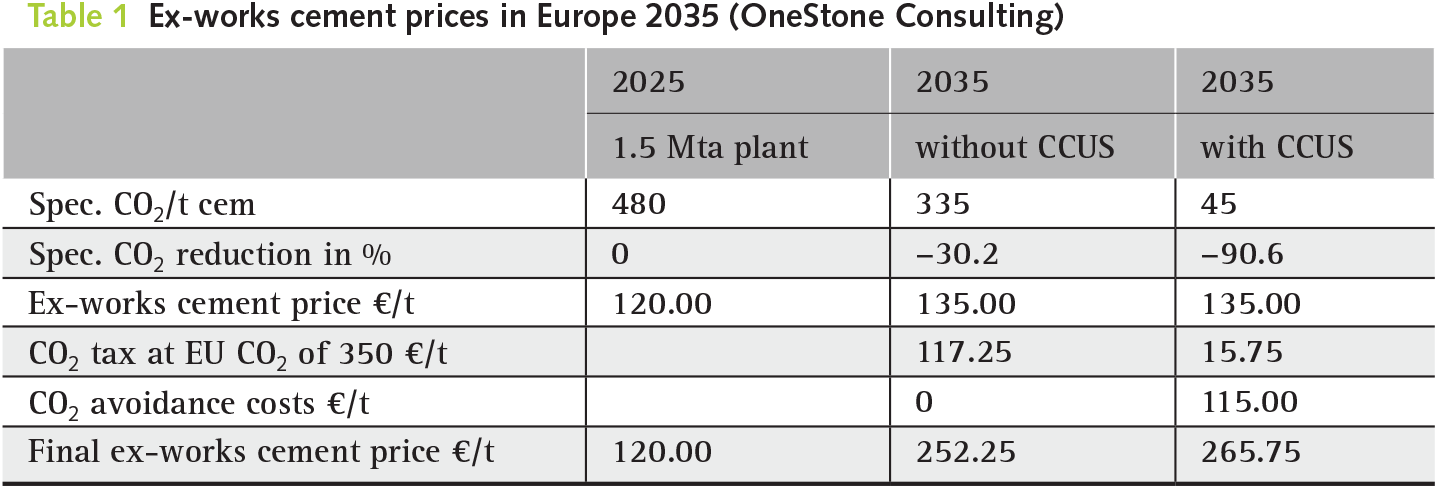
In our example the regular ex-works cement prices slightly increase to 135€/t of cement, while the price for EU carbon permits has been set at 350€/t CO2. For Plant A this leads to a hypothetical CO2 tax of €117.25/t of cement in 2035, while for Plant B with the CCUS system this still leads to €15.75/t of cement. In our example we calculated the CO2 avoidance costs at a moderate €115.00/t of cement. Accordingly, all costs are based on the cement production. The result is that in 2035, Plant A can be operated with ex-works cement prices of 252.25€/t of cement, while the ex-works price of Plant B with CCUS system increases to 265.75€/t of cement. Nevertheless, despite this disadvantage of CCUS systems, it has to be investigated how the CO2 avoidance costs of CCUS systems can be further reduced. Setting higher EU carbon permits than 350€/CO2 is definitely the wrong signal.
In a range of EU carbon permit prices below 350€/t of CO2 CCUS systems are not economical. The difficulty is that any return of investment (ROI) calculation of a CCUS system depends solely on the carbon price. The avoidance costs can make a difference between two different carbon capture systems, but cannot be compared to conventional measures in decarbonisation, where an investment leads to a reduction of the production costs and can achieve a positive ROI in 5 years. Examples are alternative fuels, energy reduction, installing WHR systems, reducing the clinker factor by using calcined clay, using steel slags as a raw material, reducing the downtime of a plant, integrating AI technology and many more. At the moment, in the cement industry there are about 250 to 320 projects each year following these pathways. Each project saves between 0.03 and 0.07 Mta of CO2 emissions, which accumulates to about 12–15 Mta. ROI periods below 5 years can be achieved.
The facts clearly show that in the cement industry, carbon capture, utilisation and storage (CCUS) technologies are not the game changer that will bring the CO2 emissions to net-zero [6, 14, 15]. With the one-sided large-scale funding of CCUS technologies the EU political leadership is sending the wrongs signals. Now, the situation is different. Even the flagship CCUS projects by the cement industry have only a small chance of implementation without co-financing by the EU Innovation Fund or other Government funding schemes. The cement industry’s call for even more government support for this technology is not the solution. Instead of funding uneconomic projects, funds need to be directed to smart decarbonisation projects with a short ROI. This is the solution.